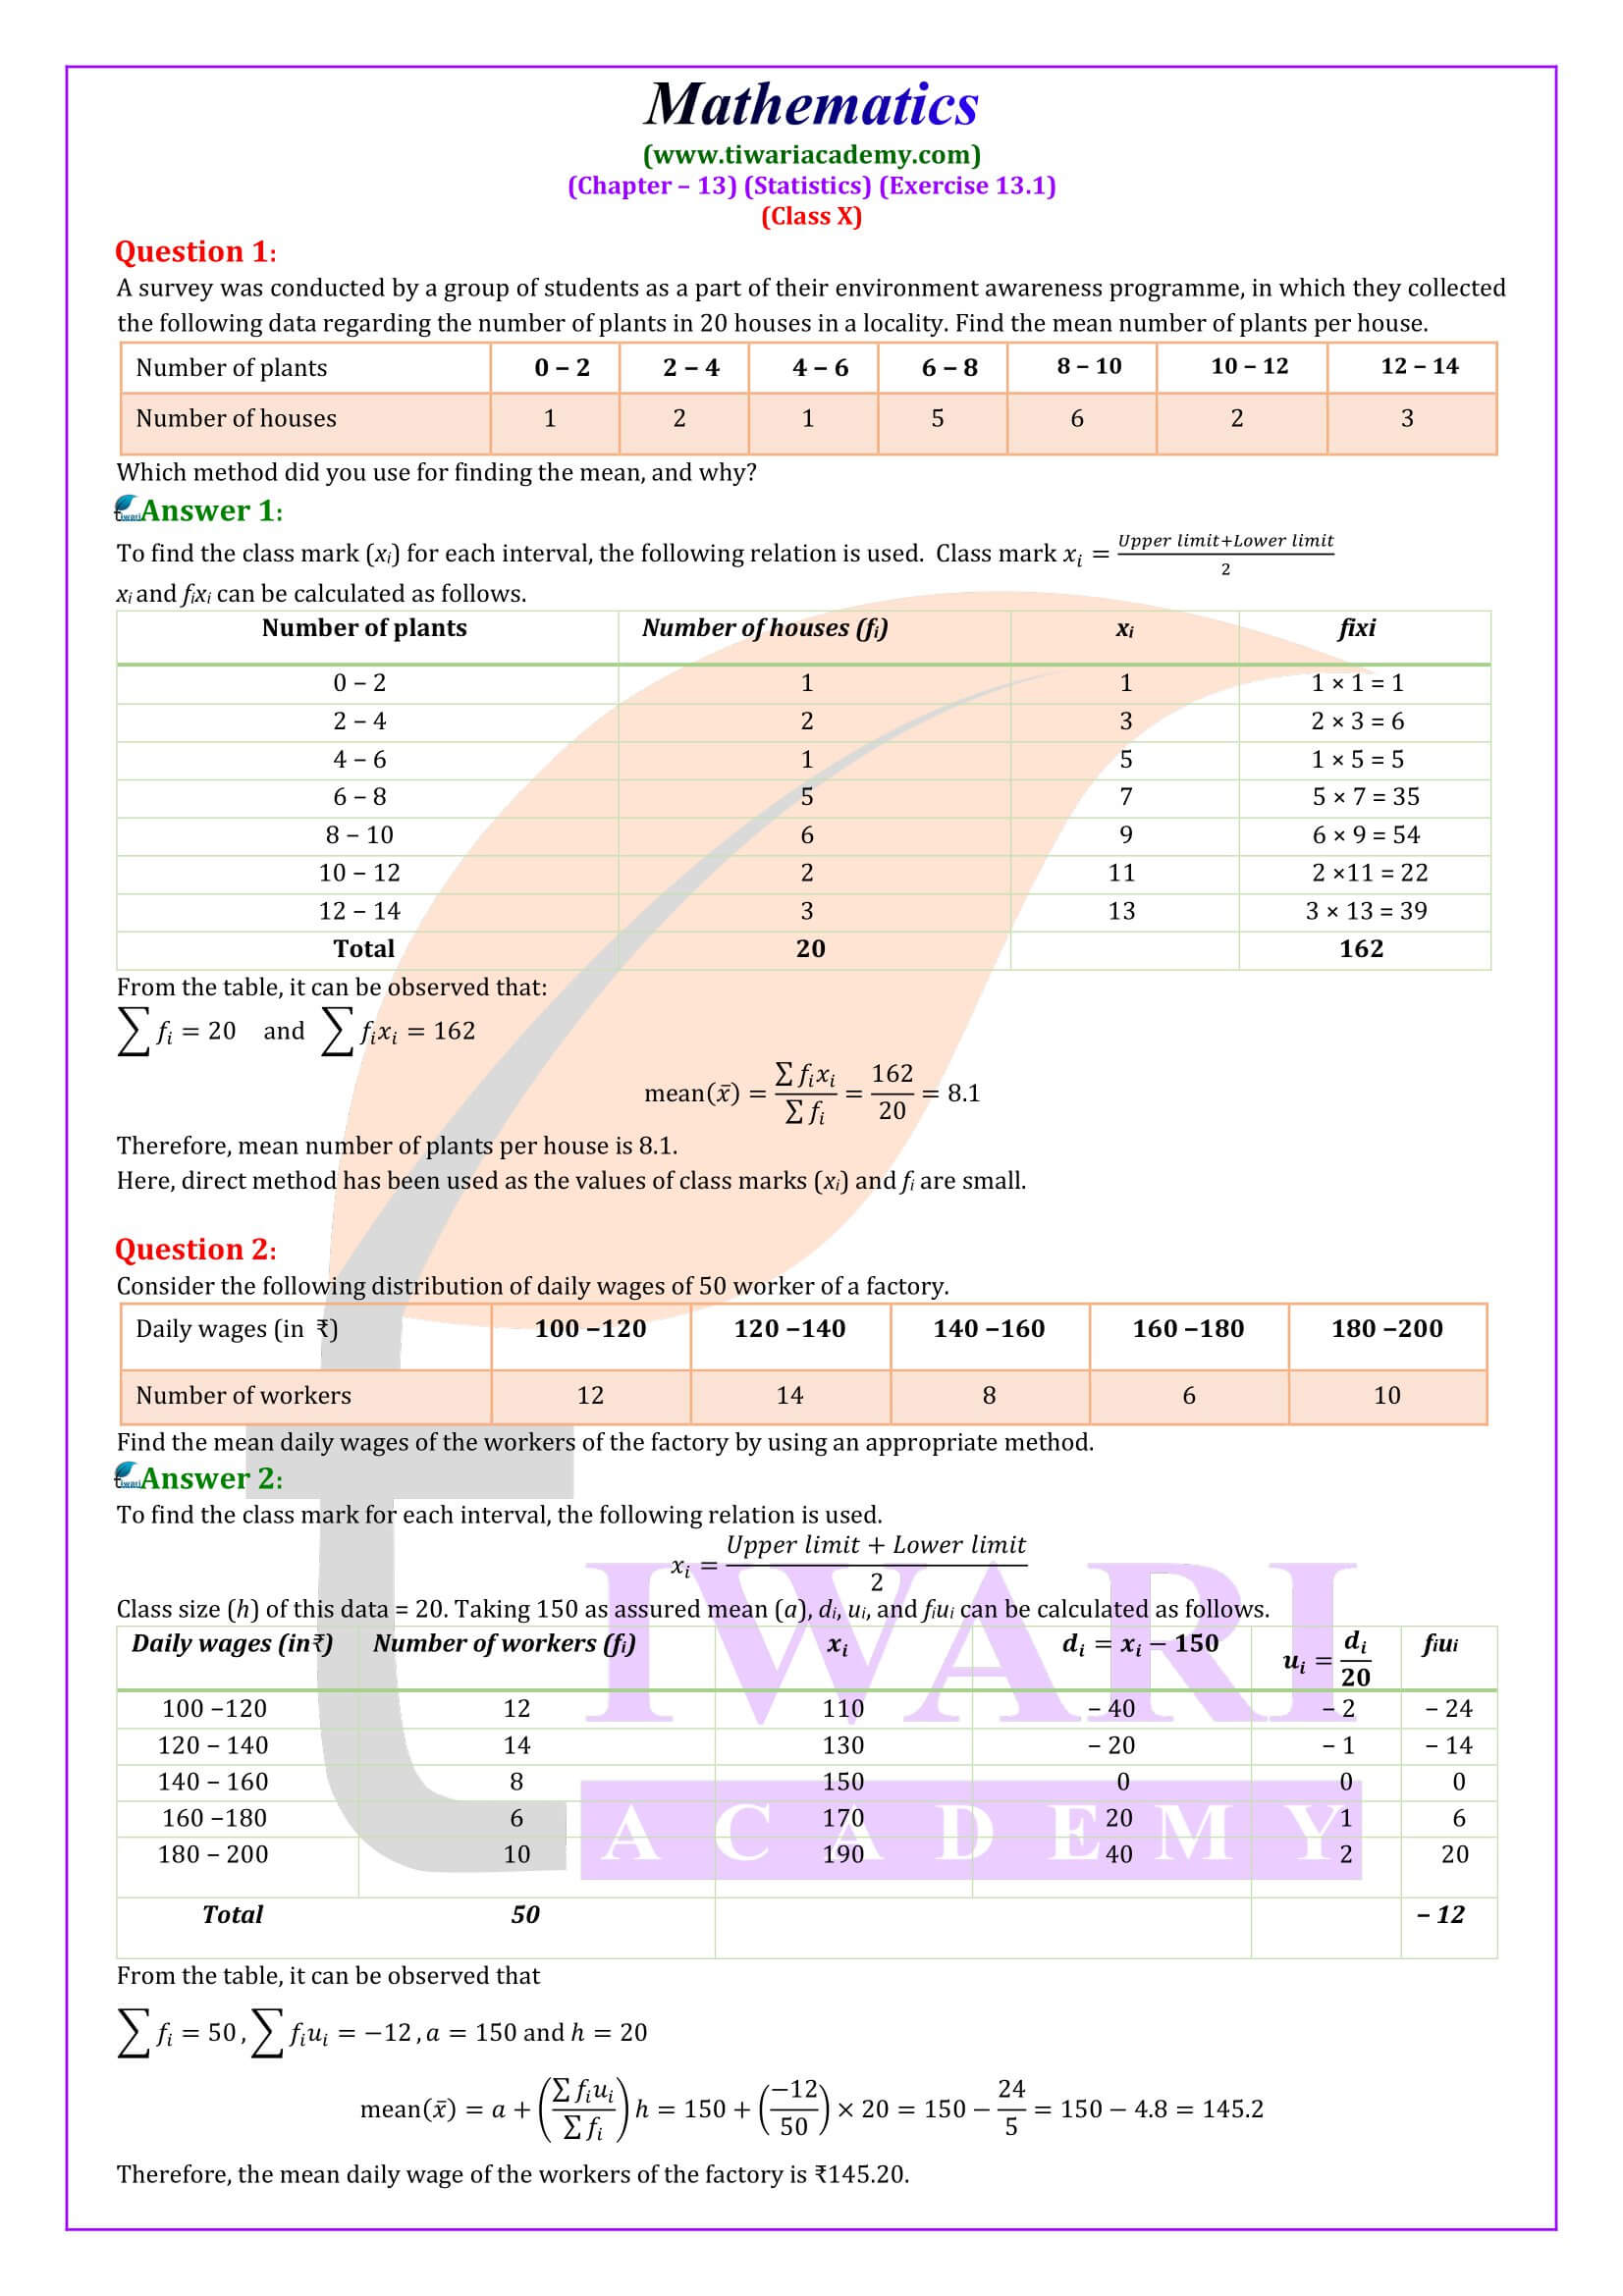
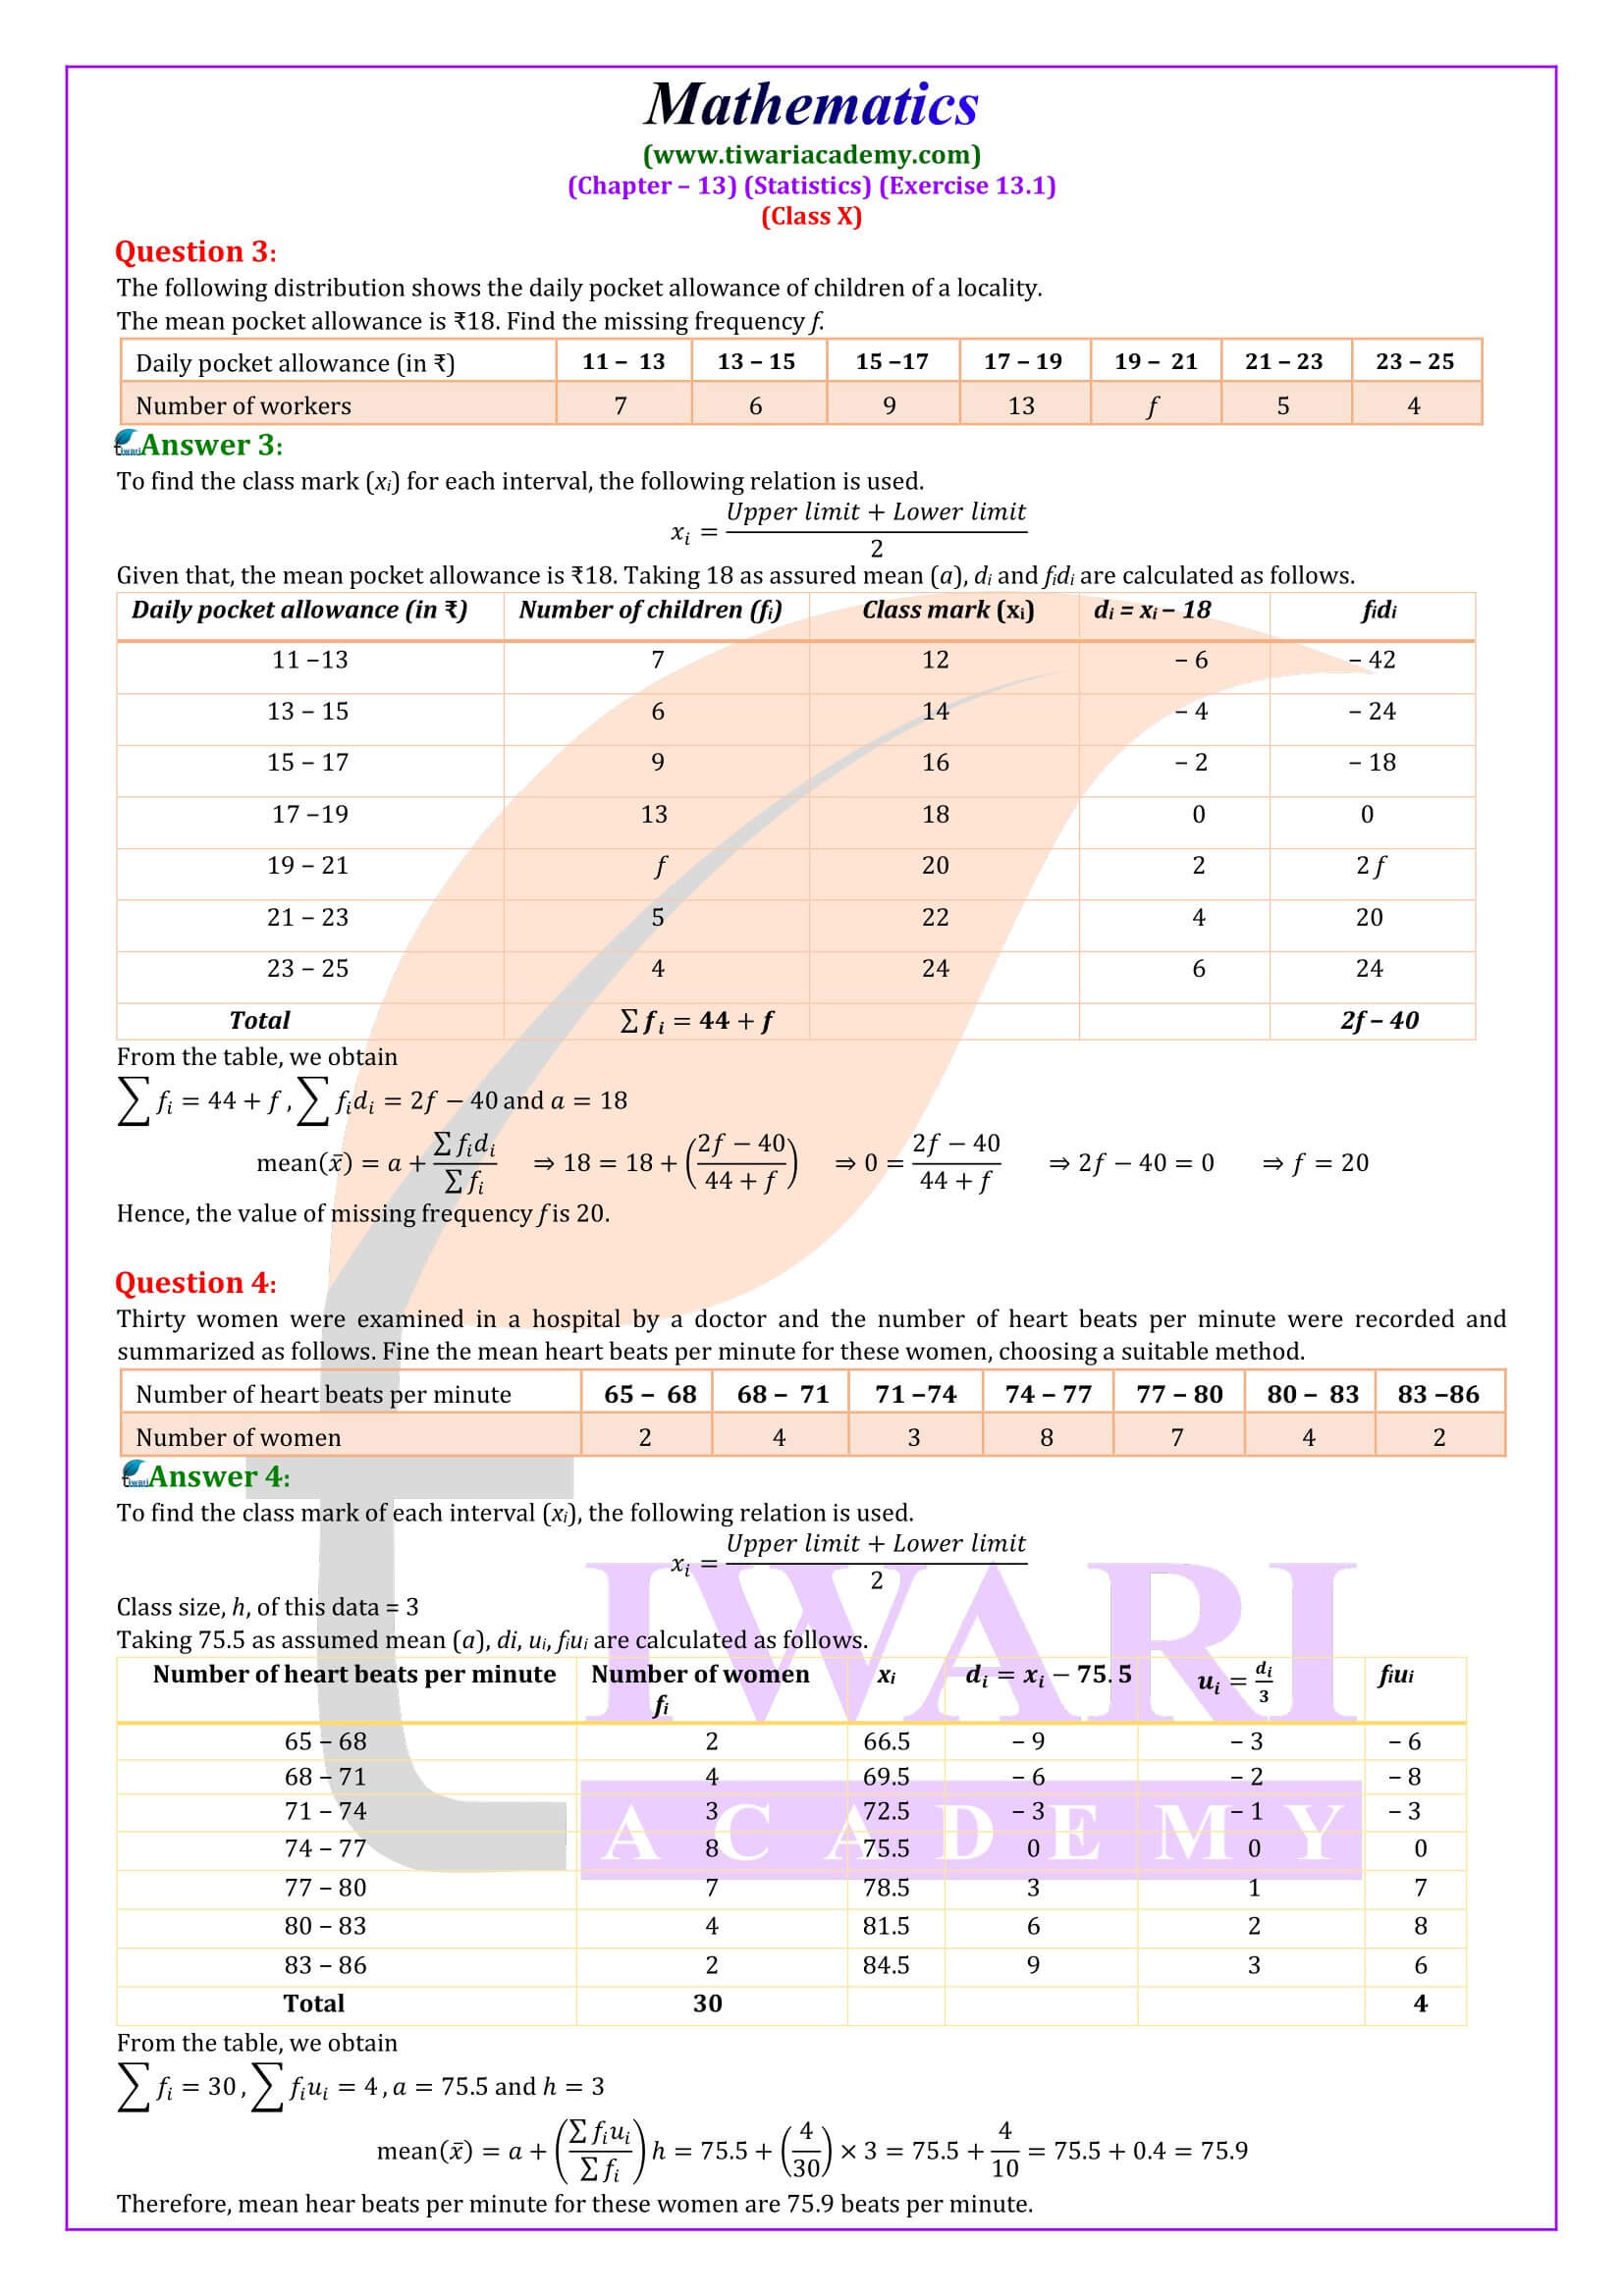
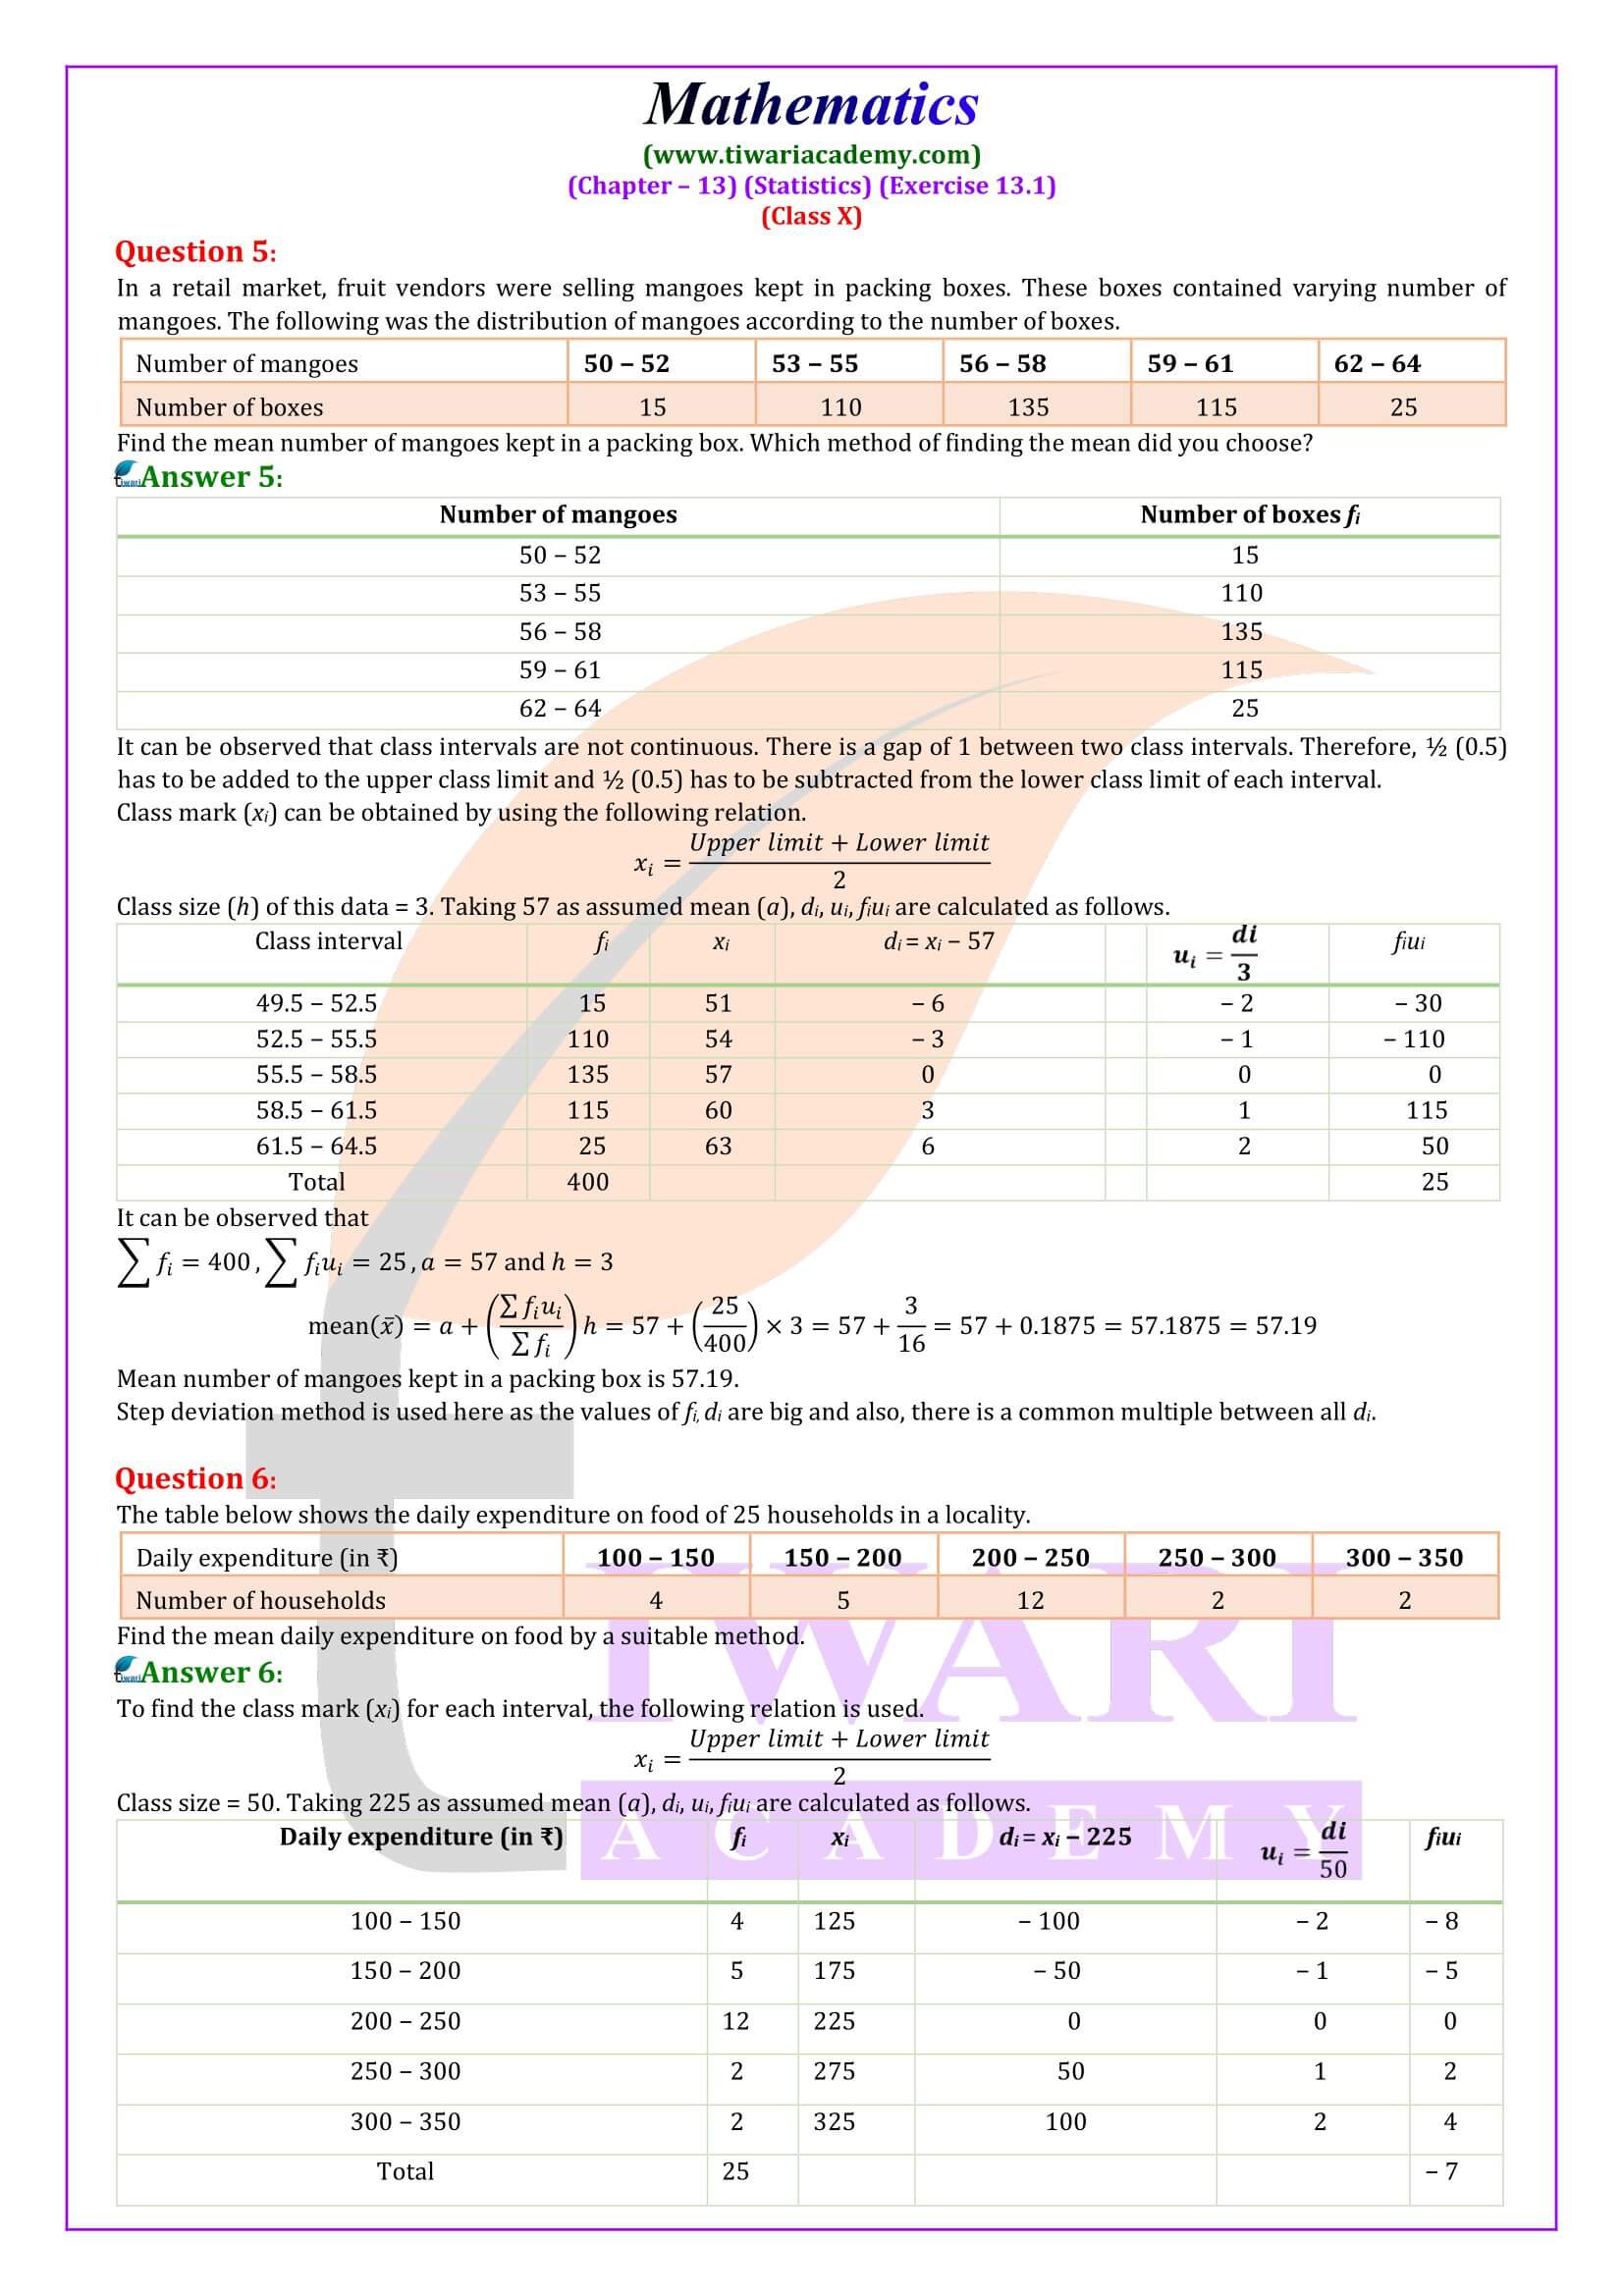
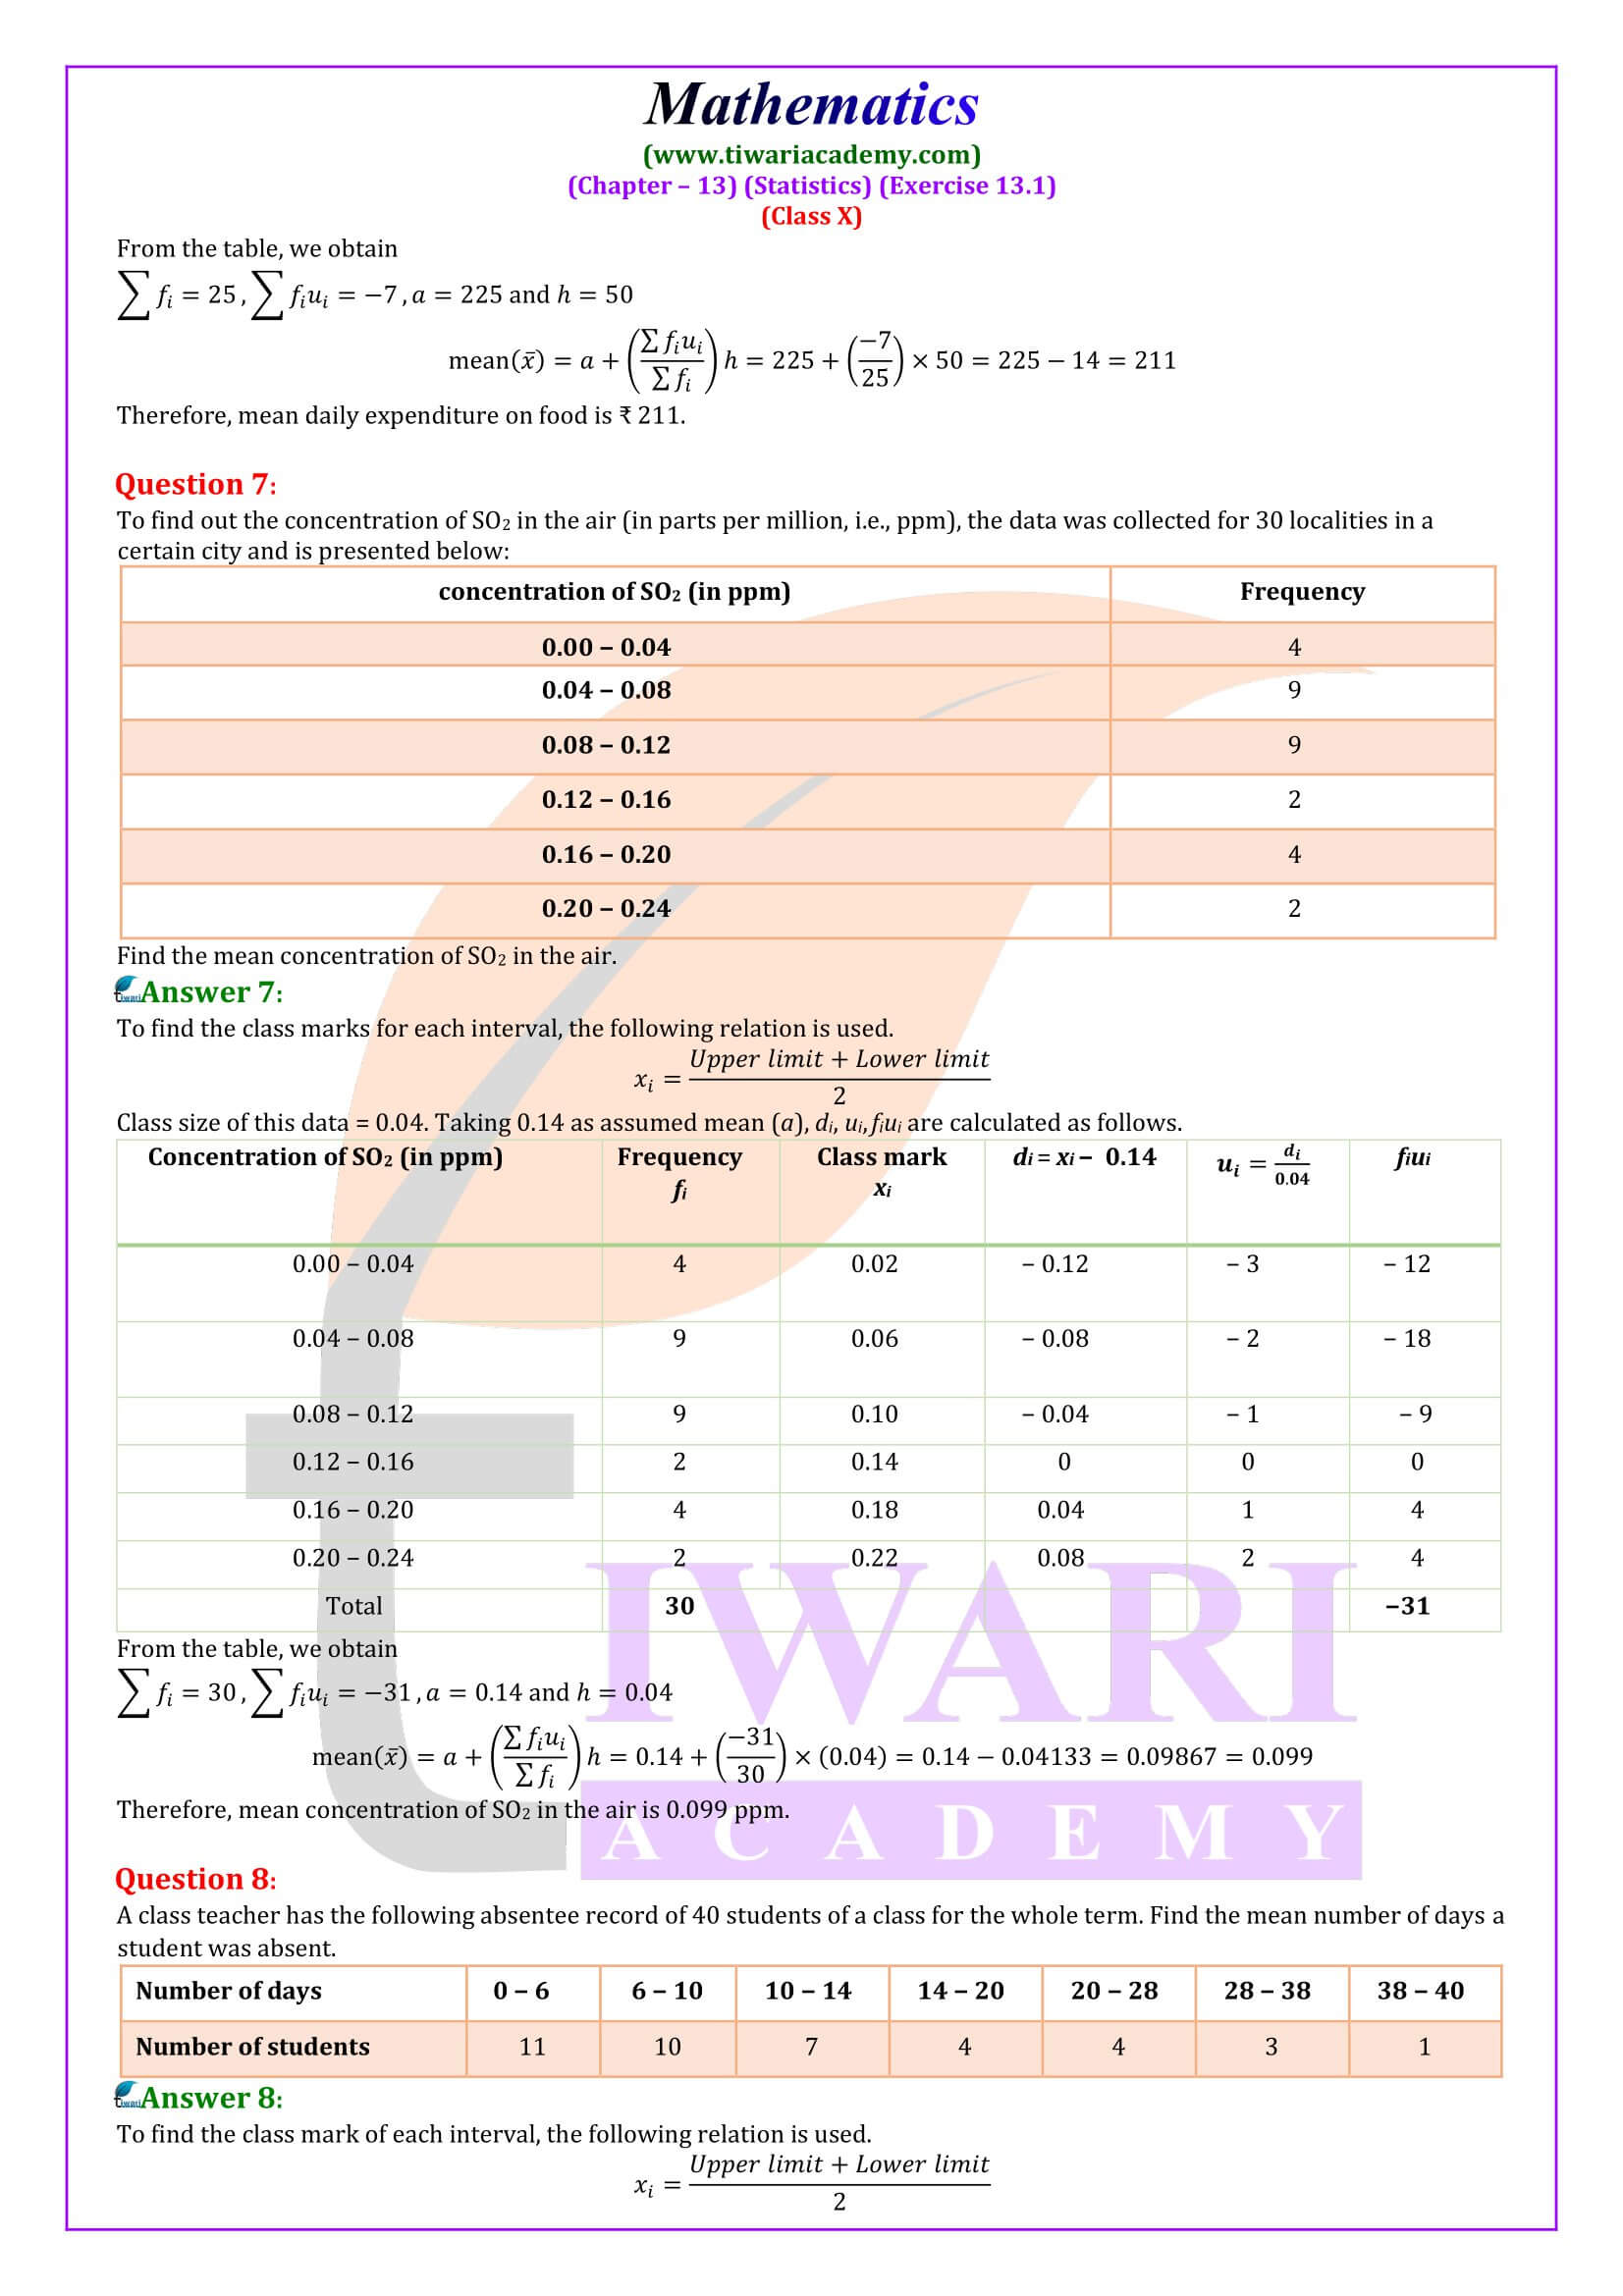
NCERT Solutions for Class 10 Maths Chapter 13 Exercise 13.1 Statistics in Hindi and English Medium for session 2024-25. The solutions of ex. 13.1 of 10th Maths is simplified so that student can understand it easily.
| Class: 10 | Mathematics |
| Chapter: 13 | Statistics |
| Exercise: 13.1 | NCERT Textbook Solutions |
| Session: | CBSE 2024-25 |
| Medium: | Hindi and English Medium |
Class 10 Maths Exercise 13.1 Solutions in Hindi and English Medium
All the question answers are solved in Hindi and English Medium free to use or download in PDF file format. Videos related to Exercise 13.1 of statistics are given in both Hindi and English Medium, so that students can understand each questions easily. Practice here with extra questions to score more in exams.
Class 10 Maths Chapter 13 Exercise 13.1 Solutions in Hindi
Class 10 Maths Chapter 13 Exercise 13.1 Solutions in Videos
Mean of Grouped Data
The mean (or average) of the observations is the sum of the values of all observations divided by the total observations. We can write totals, in short, using the Greek letter (uppercase sigma) which means sum. In most real-life situations, the data is usually so large that to conduct a meaningful study, it must be condensed as pooled data. Therefore, we have to convert the given arbitrary data into grouped data and devise some method to find its meaning.
Important Questions of 10th Maths Exercise 13.1
How to Create Class Intervals for a given data?
Now, for each class interval, we need a point to serve as the representative of the entire class. The frequency of each square interval is assumed to be centered at its midpoint. Therefore, the midpoint (or class grade) of each class can be chosen to represent observations that come in the classroom. Remember that we find the median of a square (or its class grade) to be the average of its upper and lower limits.
Which method is best for finding mean?
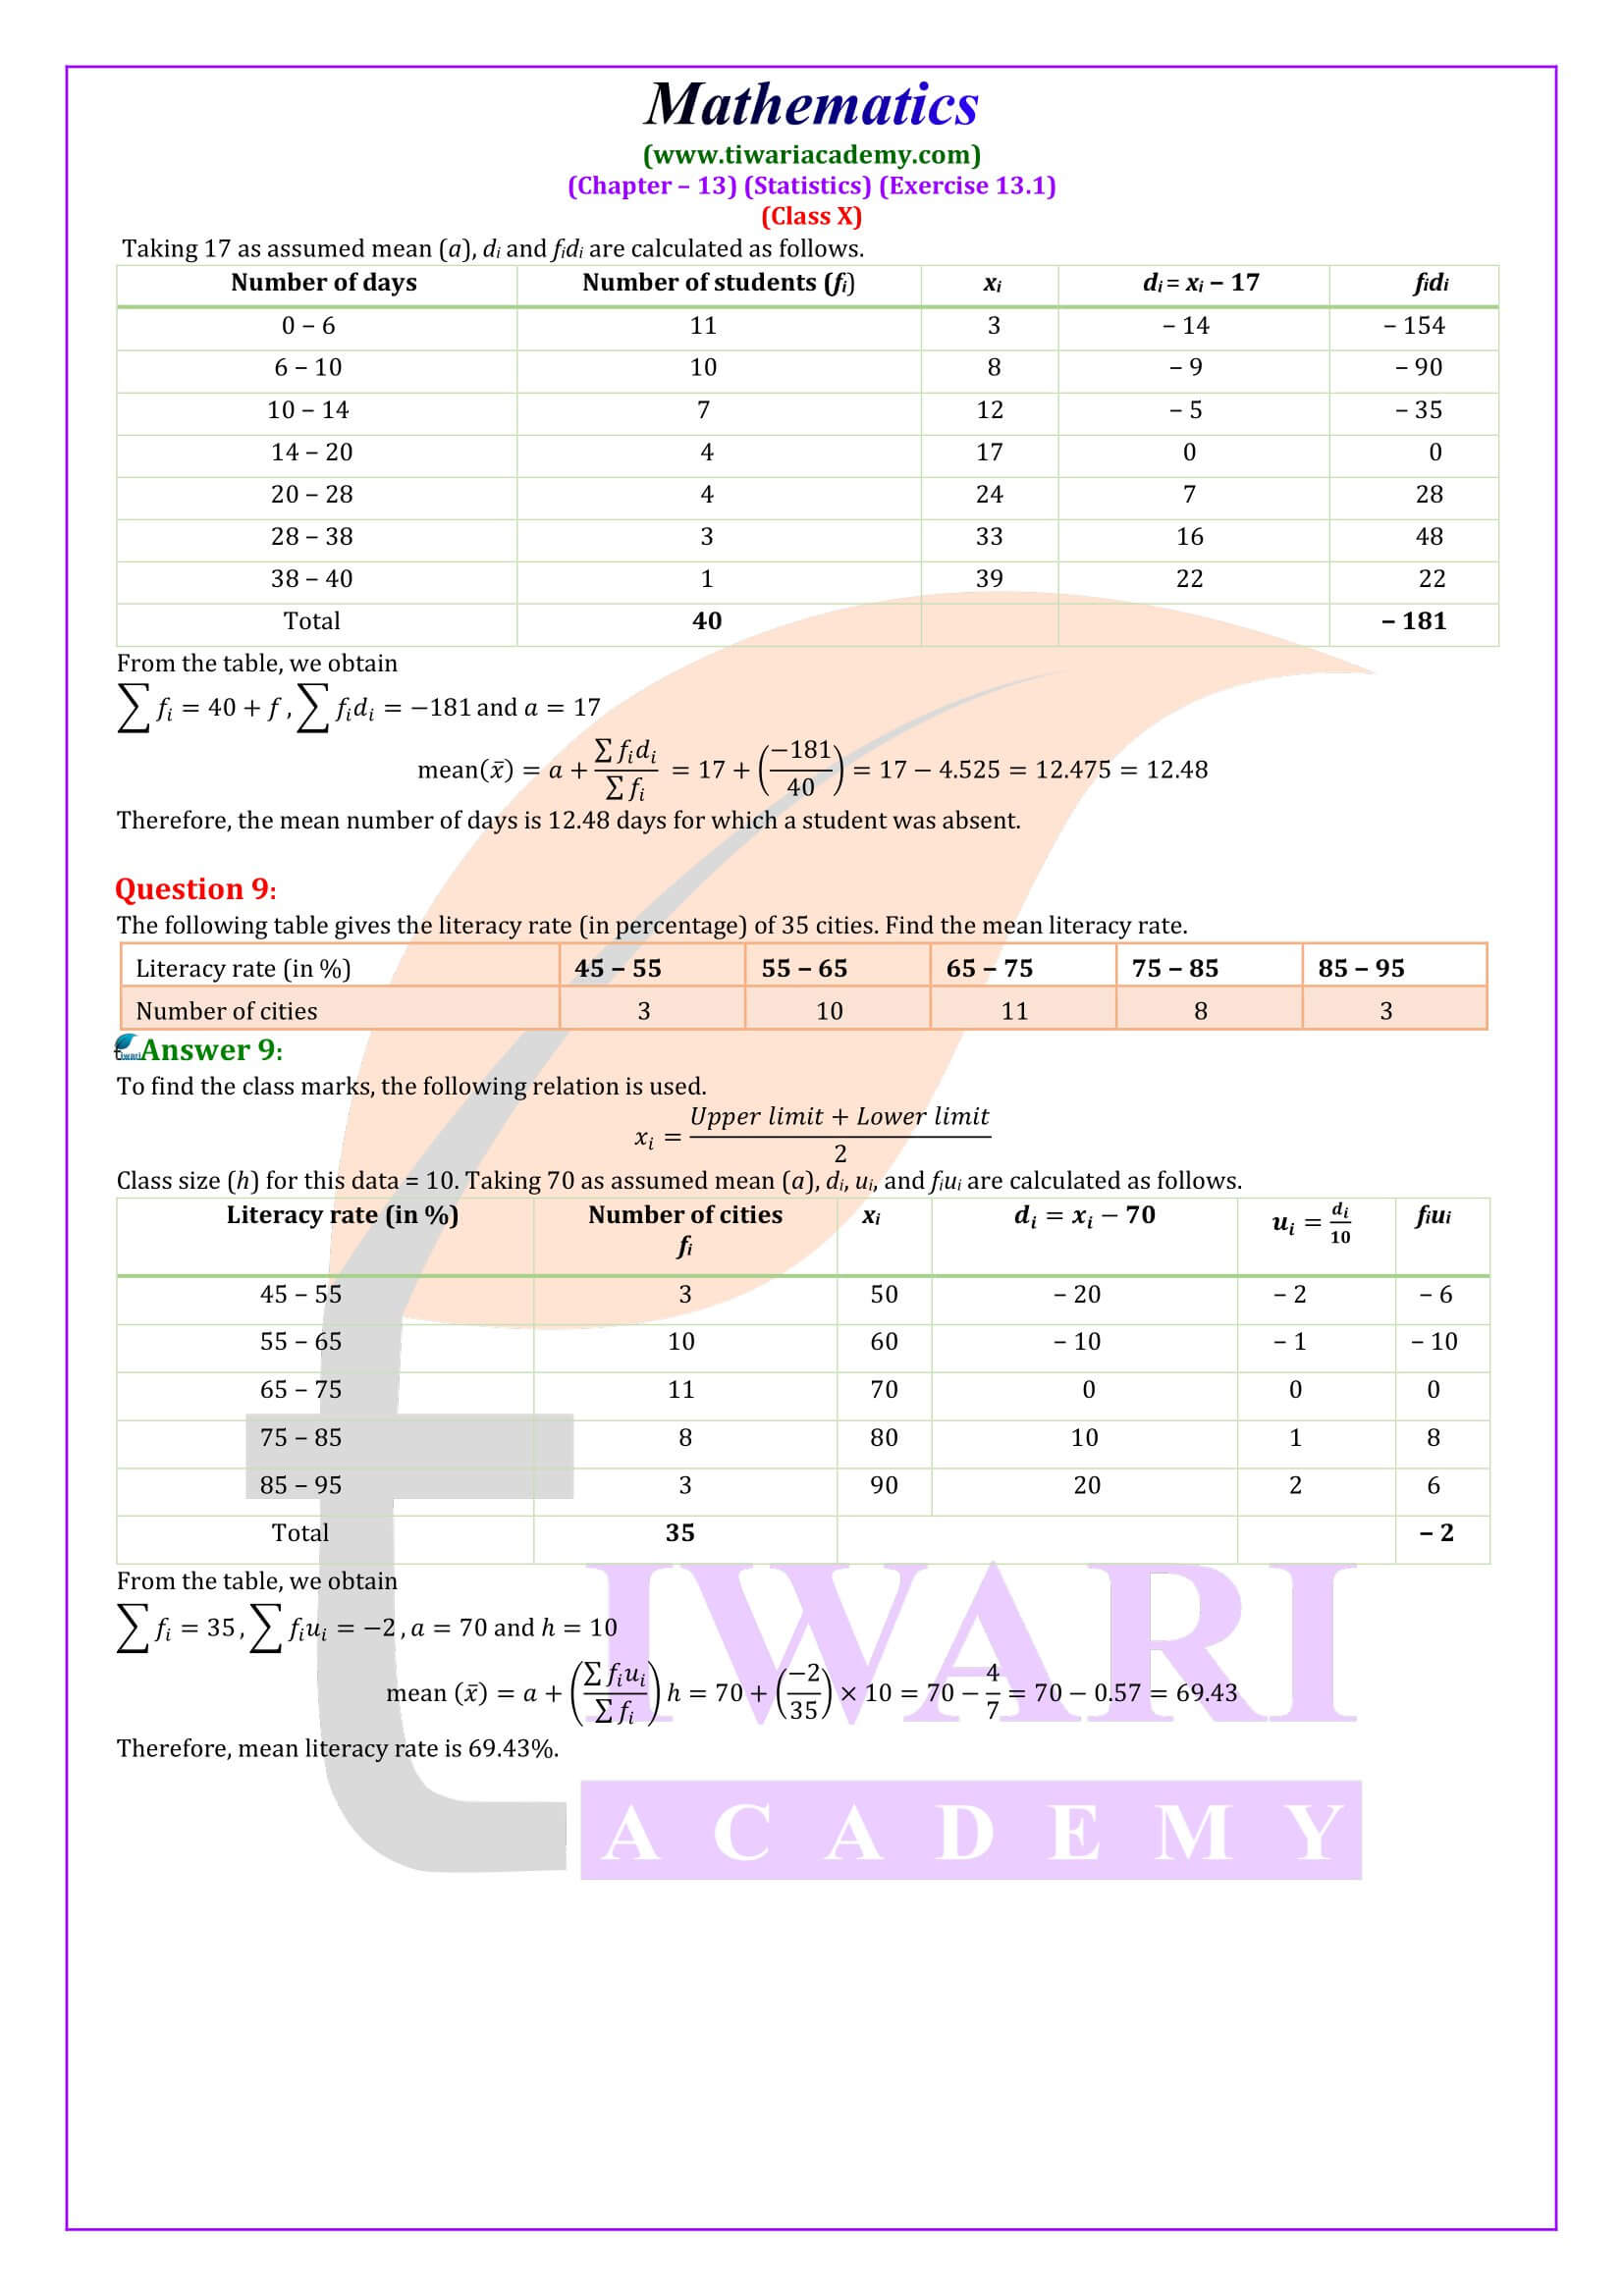
The result obtained by all three methods is the same. Therefore, the choice of method to use depends on the numerical values of xi and fi. If xi and fi are small enough, the direct method is a good choice. If xi and fi are numerically large numbers, we can choose either the assumed mean method or the stepwise deviation method. If the square sizes are unequal and xi is numerically larger, we can still apply the stepwise deviation method by taking H as a suitable separator.
How to prepare Frequency Distribution Table?
Remember that when assigning frequencies at intervals of each class, students who fall in the range of any higher class will be considered in the next class, for example, 4 students scoring 50 marks in the 50–65 class. Will be considered in intervals and not in 35–50. With this convention in mind, let’s create a grouped frequency distribution table.
Why is Short-Cut-Method useful?
Using the same data and using the same formula to calculate the mean, but the results obtained are different. Do you know why this happened and which is more accurate? The difference between the two values is due to the assumption of midpoint. The exact mean can be different from the assumed mean or the estimated mean.
Sometimes when the numerical values of data (x) and frequency (f) are large, finding the product of x and f becomes tedious and time-consuming. So for such situations, we use a method to reduce these calculations. These are shortcut ways to find trend centers.
The Assumed Mean Method.
In the assumed mean method, we simply assume a random numerical mean and calculate the actual mean of the data. After calculating the final mean, we assume that the value of the mean obtained does not depend on the choice of the mean taken.
Step deviation method
If all di has a common factor, then it will be convenient to apply the stepwise deviation method. The mean obtained by either method is the same. The assumed average method and the phase deviation method are only simplified forms of the direct method. The formula x = a + hu is still valid if a and h are not the methods given above, but are nonzero.
Activity to find the Mean practically
Divide the students in your class into three groups and ask each group to do one of the following activities.
- Collect the marks obtained in Mathematics (or in any other subject) by all the students of your class in the final examination (or terminal examination) conducted by your school. A pooled frequency distribution form of received data.
- Collect the maximum daily temperature recorded in your city for a period of 30 days. Present these data in the form of a grouped frequency table.
- Measure the heights of all the students in your class (in cm) and draw a pooled frequency distribution table from these figures.
- Once all the groups have collected the data and created the grouped frequency distribution tables, the groups will have to find the mean of whatever is appropriate through each method in each case.
What are the situations in ex. 13.1 of 10th Maths where finding mean is more appropriate?
The mean is the most frequently used measure of central tendency because it takes into account all the observations, and lies between the extremes, i.e., the largest and the smallest observations of the entire data. It also enables us to compare two or more distributions. For example, by comparing the average (mean) results of students of different schools of a particular examination, we can conclude which school has a better performance.
However, extreme values in the data affect the mean. For example, the mean of classes having frequencies more or less the same is a good representative of the data. But, if one class has frequency, say 2, and the five others have frequency 20, 25, 20, 21, 18, then the mean will certainly not reflect the way the data behaves. So, in such cases, the mean is not a good representative of the data.
How many methods are there in class 10 Maths Exercise 13.1 to find the mean of grouped data?
There are three methods to find the mean of grouped data. The first method is the Direct Method, the Second method is the Assumed Mean Method, and the Third method is Step-Deviation Method. The result obtained by all three methods is the same.
How to decide about methods in 10th Maths Exercise 13.1?
The choice of method to be used depends on the numerical values of xi and fi. If xi and fi are sufficiently small, then the direct method is an appropriate choice. If xi and fi are numerically large numbers, then we can go for the assumed mean method or step-deviation method. If the class sizes are unequal, and xi are large numerically, we can still apply the step-deviation method by taking h to be a suitable divisor of all the di’s.
What are the important sums of exercise 13.1 of class 10 Maths?
In exercise 13.1 of class 10 math, there are nine questions and three examples (examples 1, 2, 3). All questions and examples of this exercise are important from the exam point of view. This exercise is easy but needs practice to avoid calculation mistakes.
