on November 6, 2023, 6:09 AM
NCERT Solutions for Class 6 Maths Chapter 9 Exercise 9.3 in Hindi and English Medium updated for CBSE and State boards student. Find easy solutions for 6th Grade Maths Chapter 9, Exercise 9.3 about Data Handling in both English and Hindi at Tiwari Academy, great for CBSE and State boards.
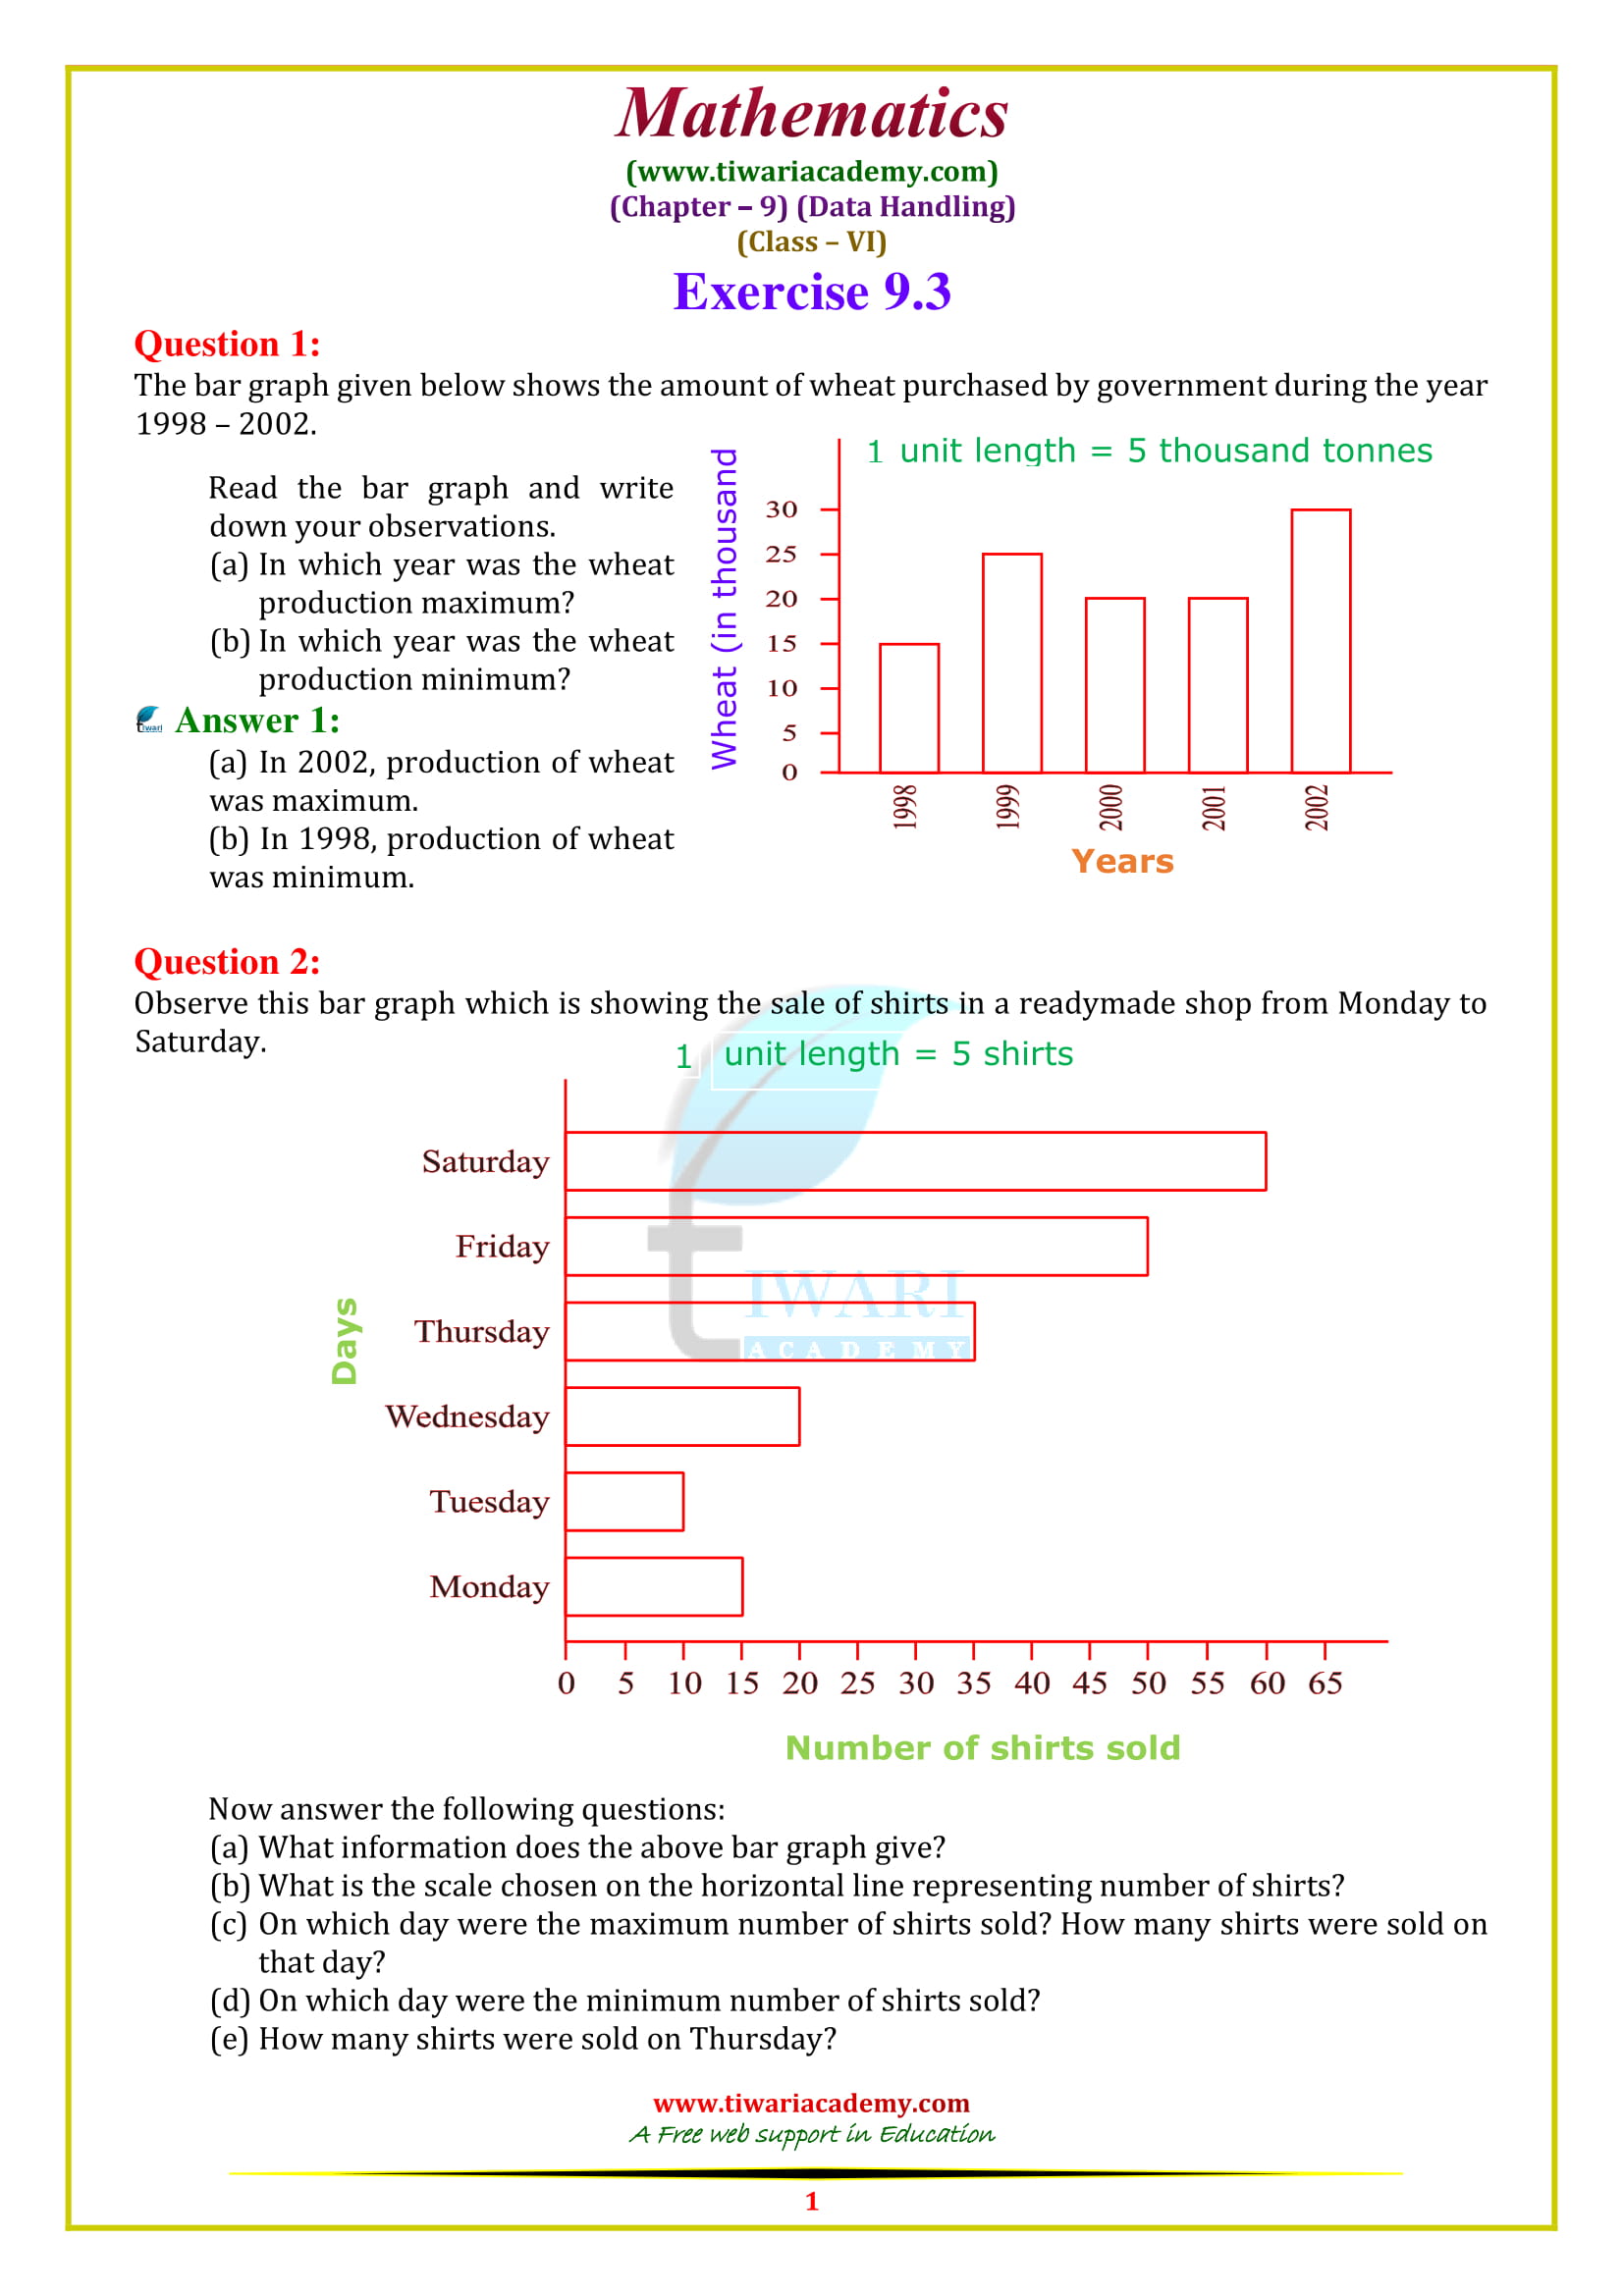
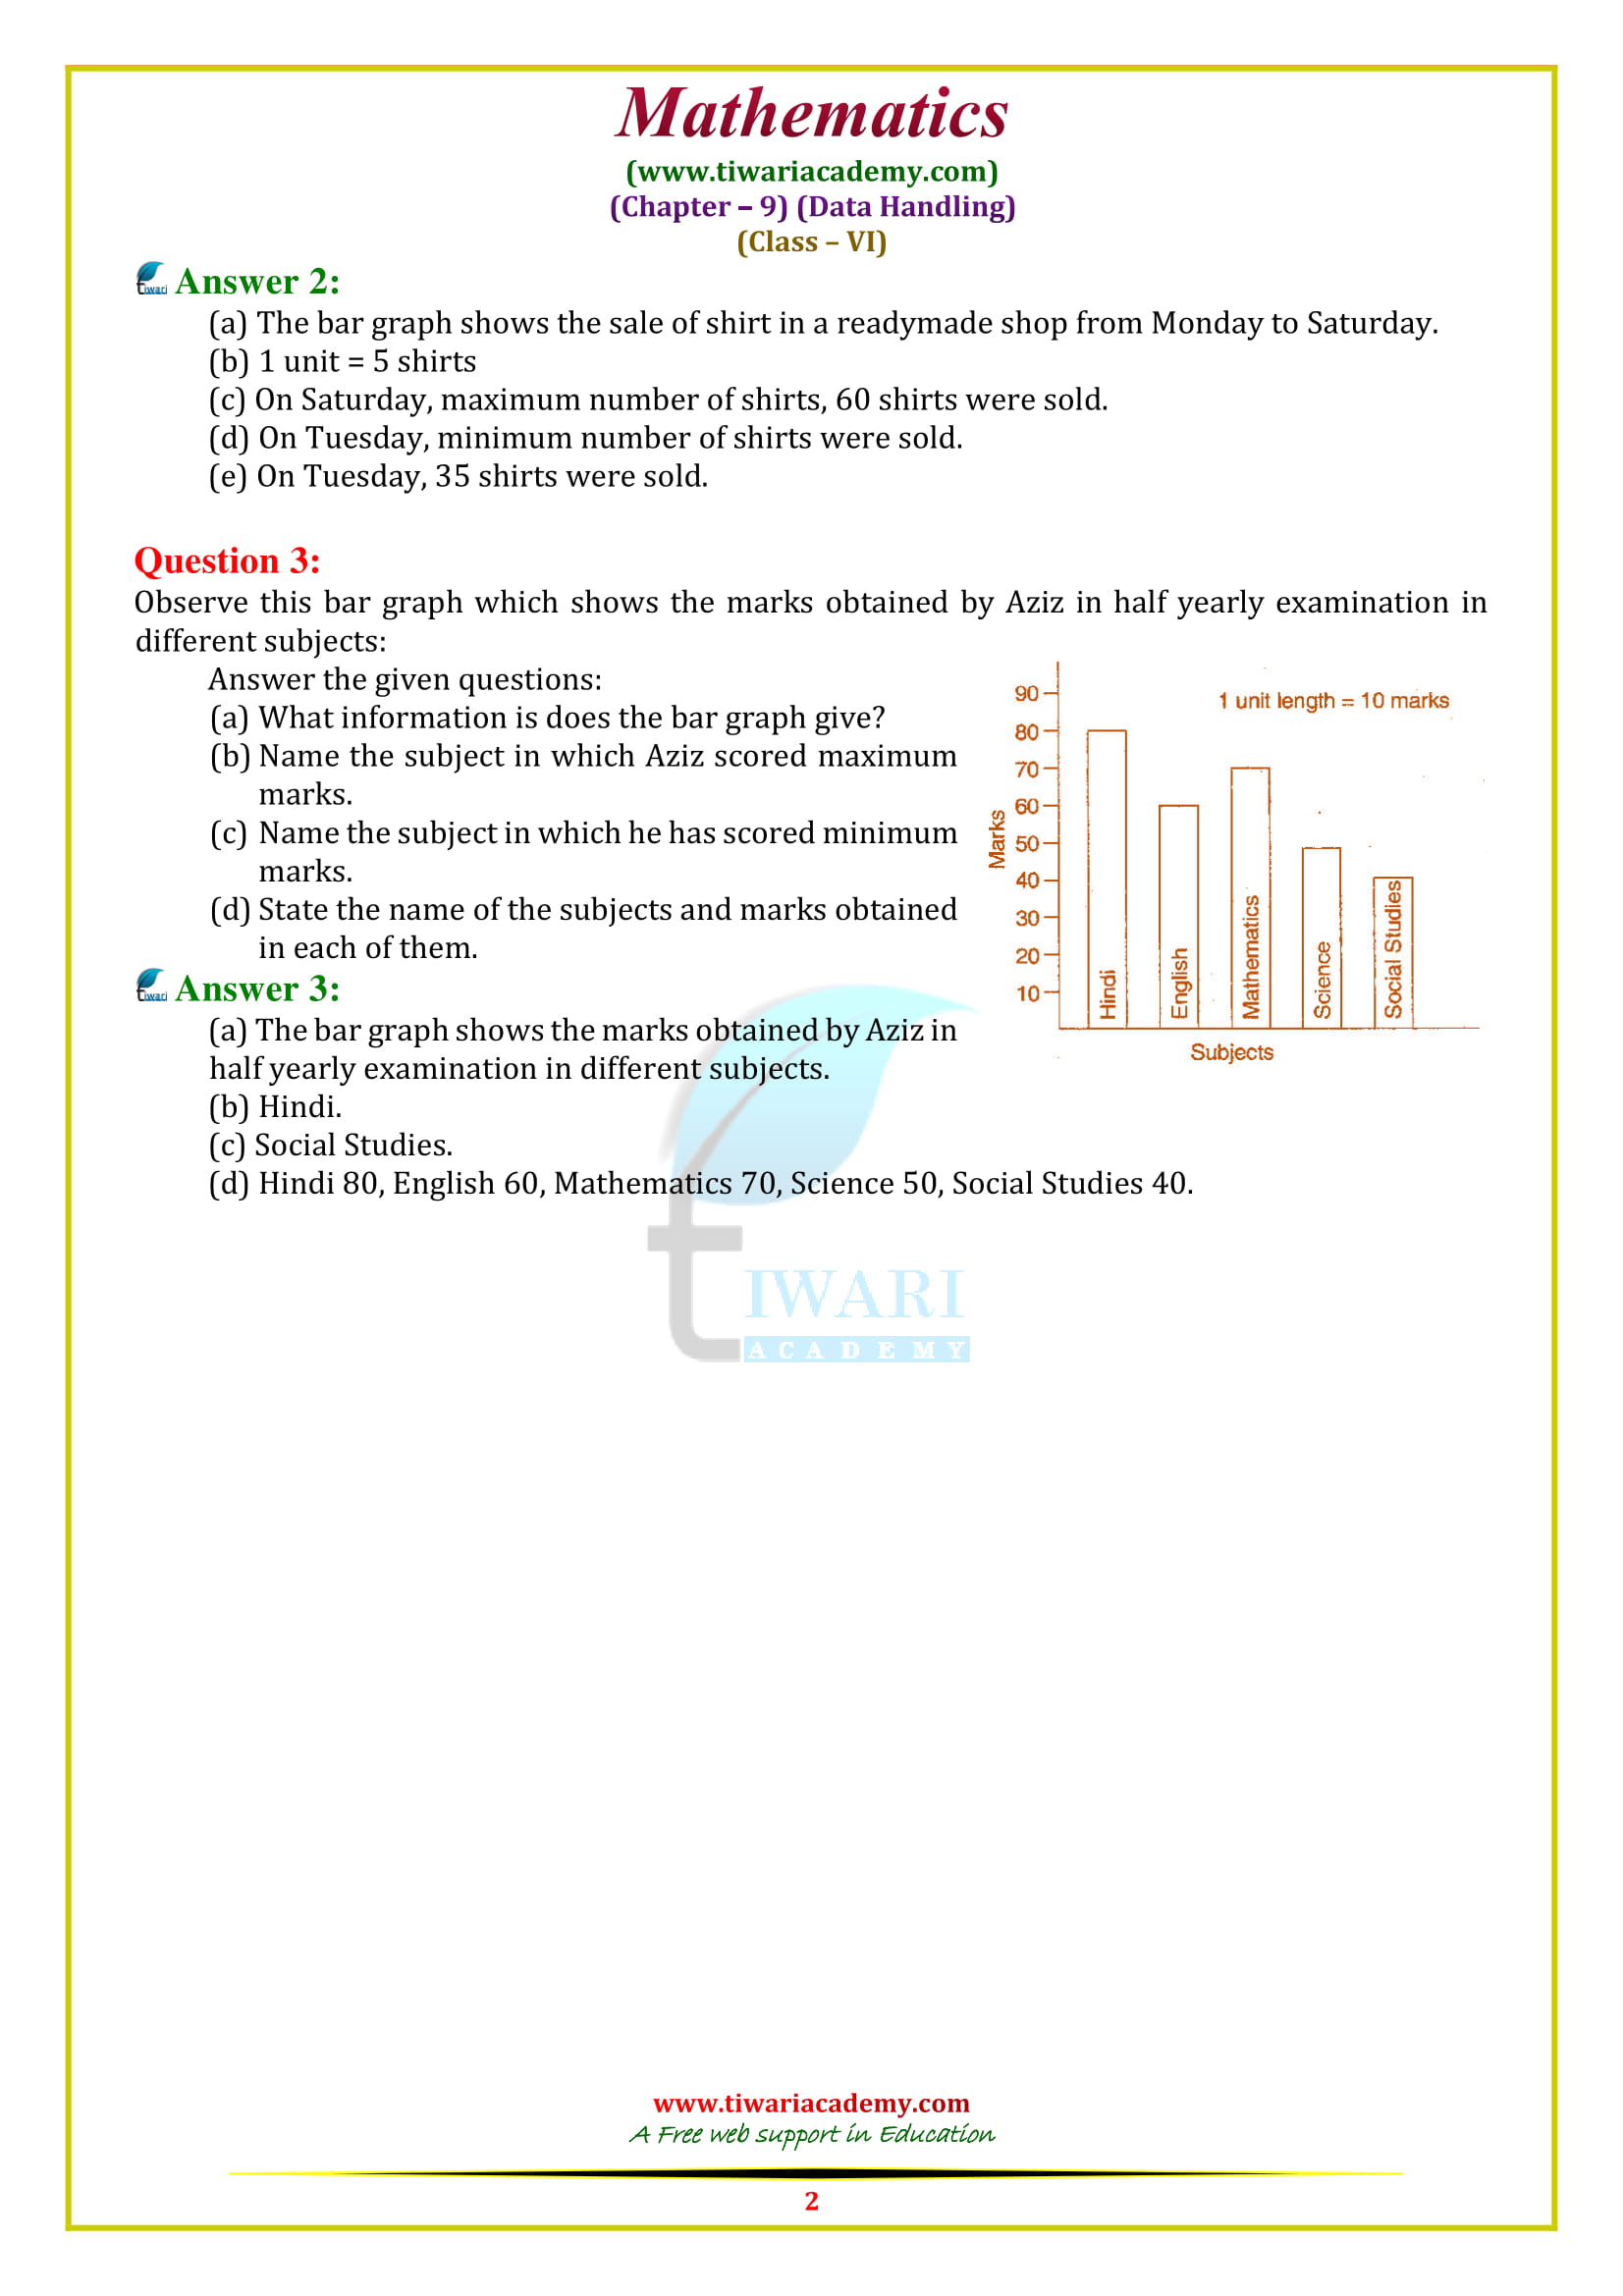
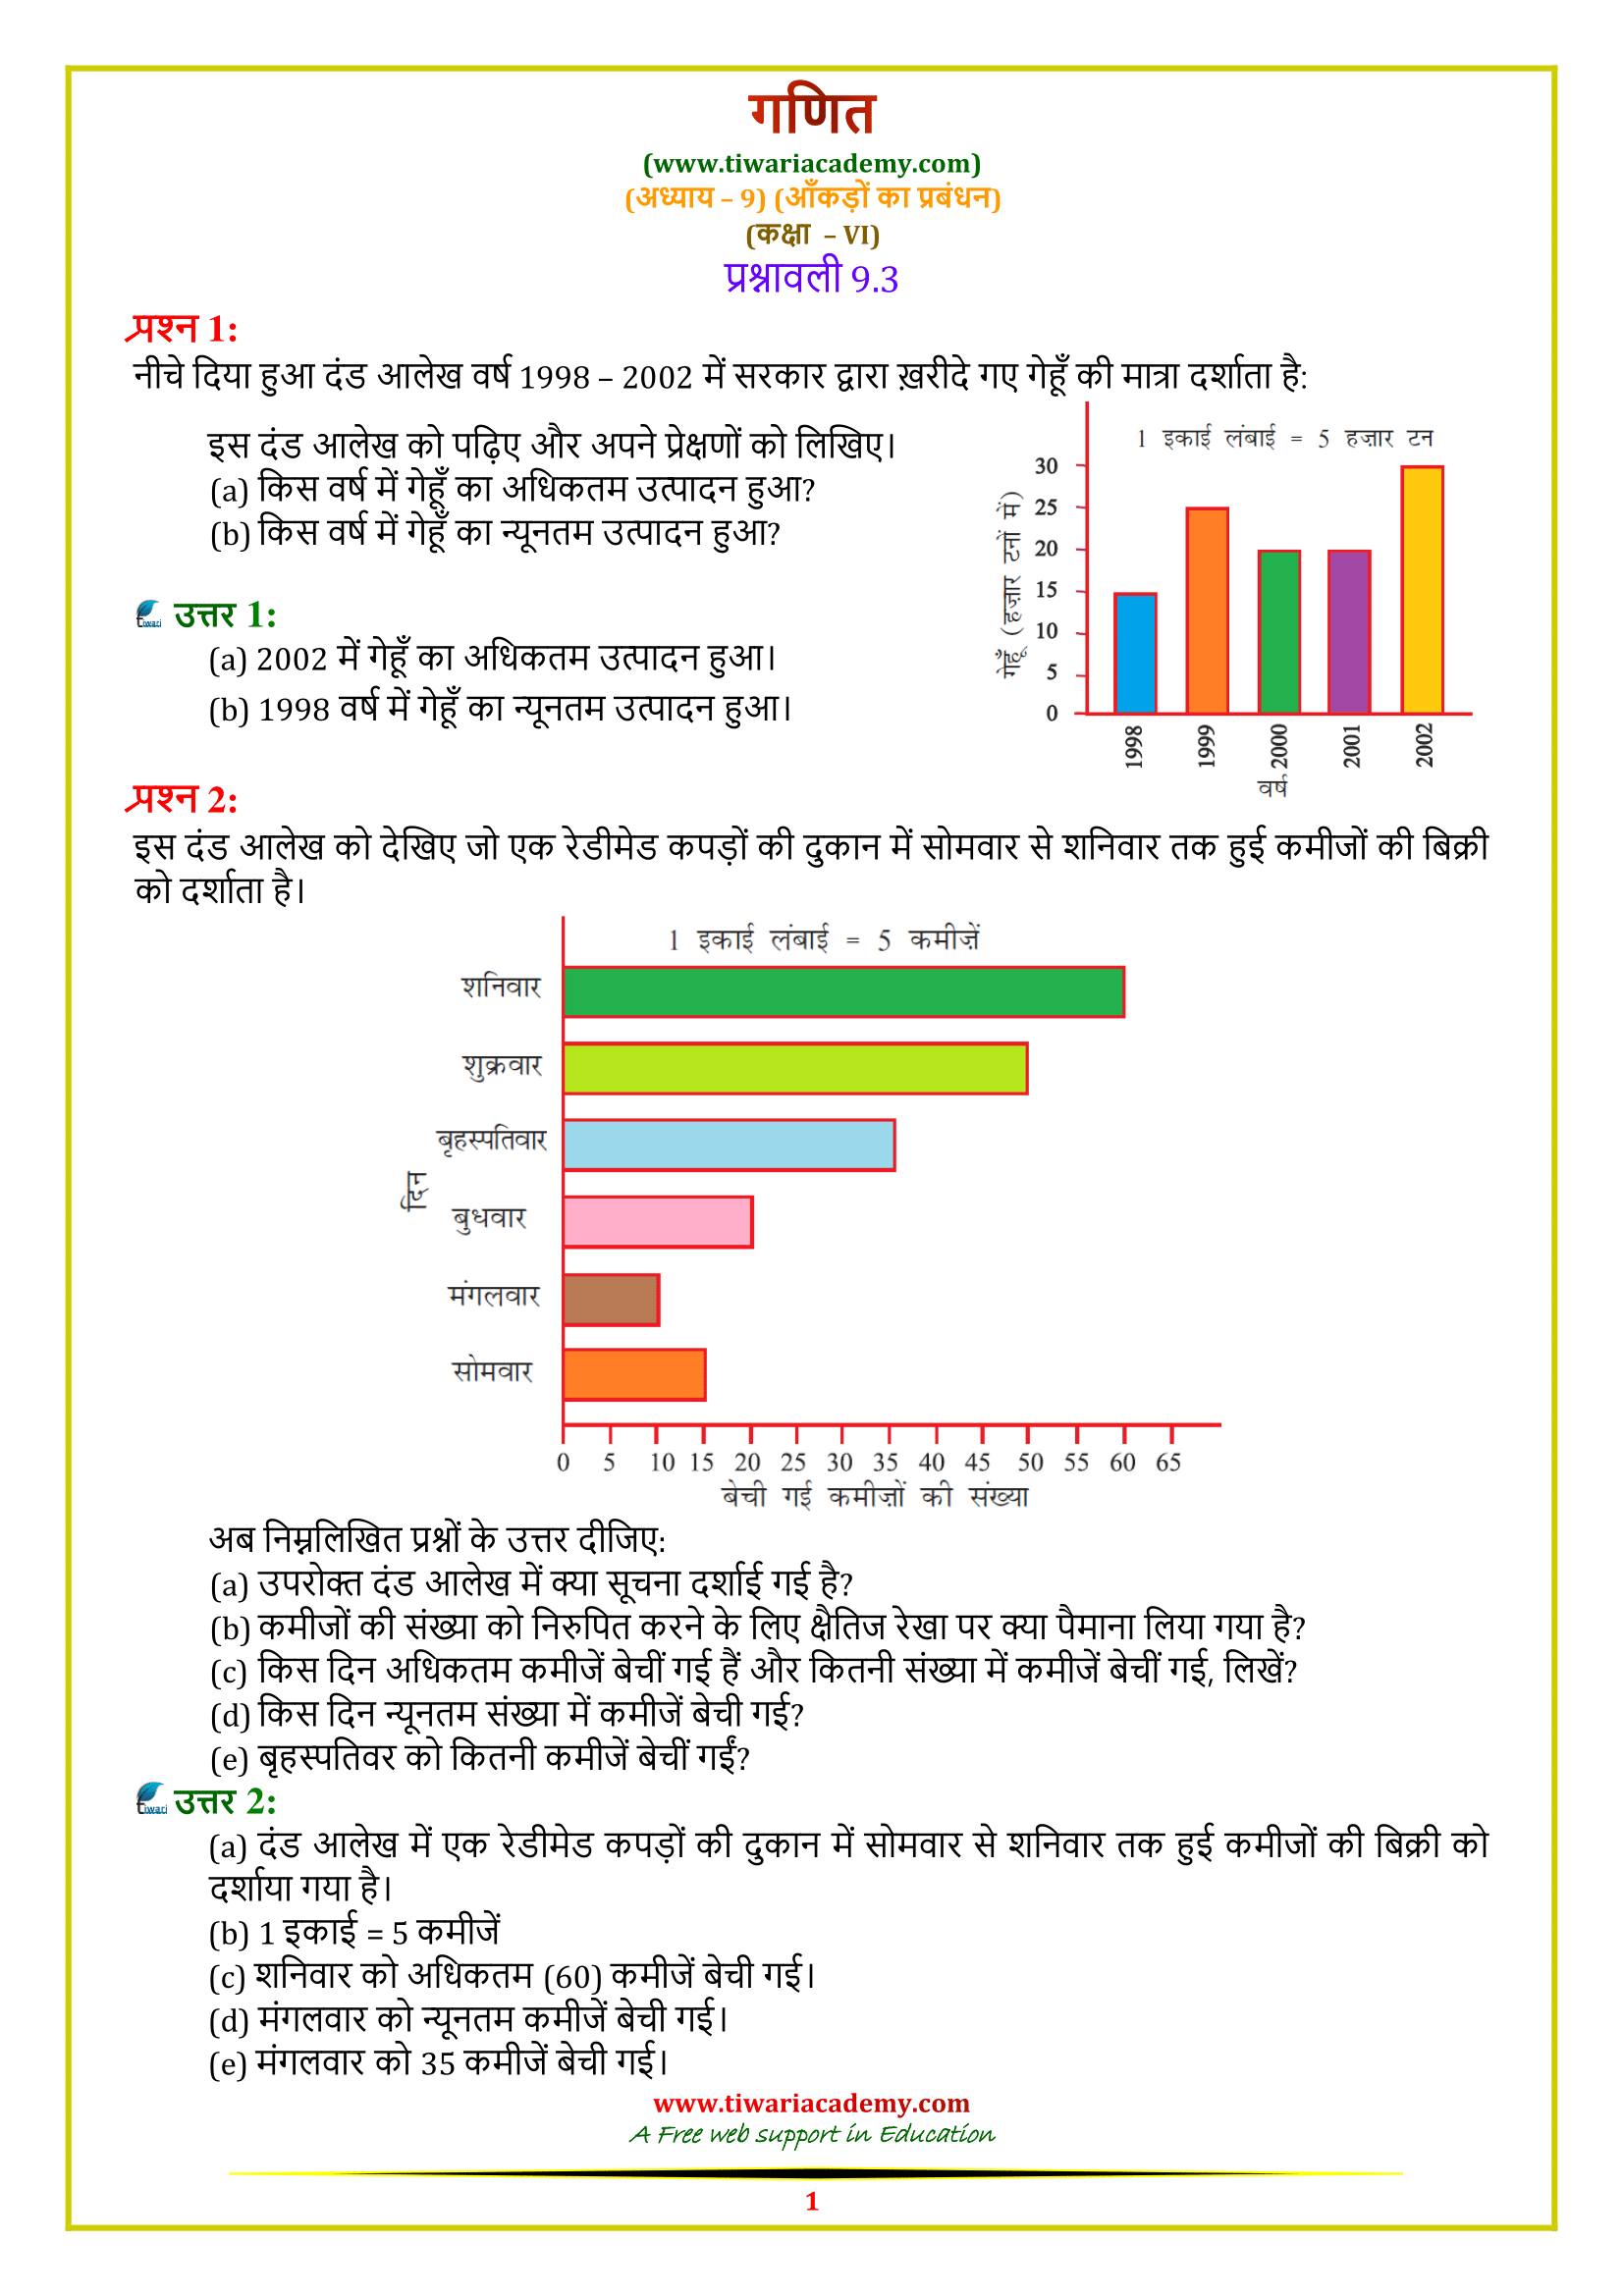
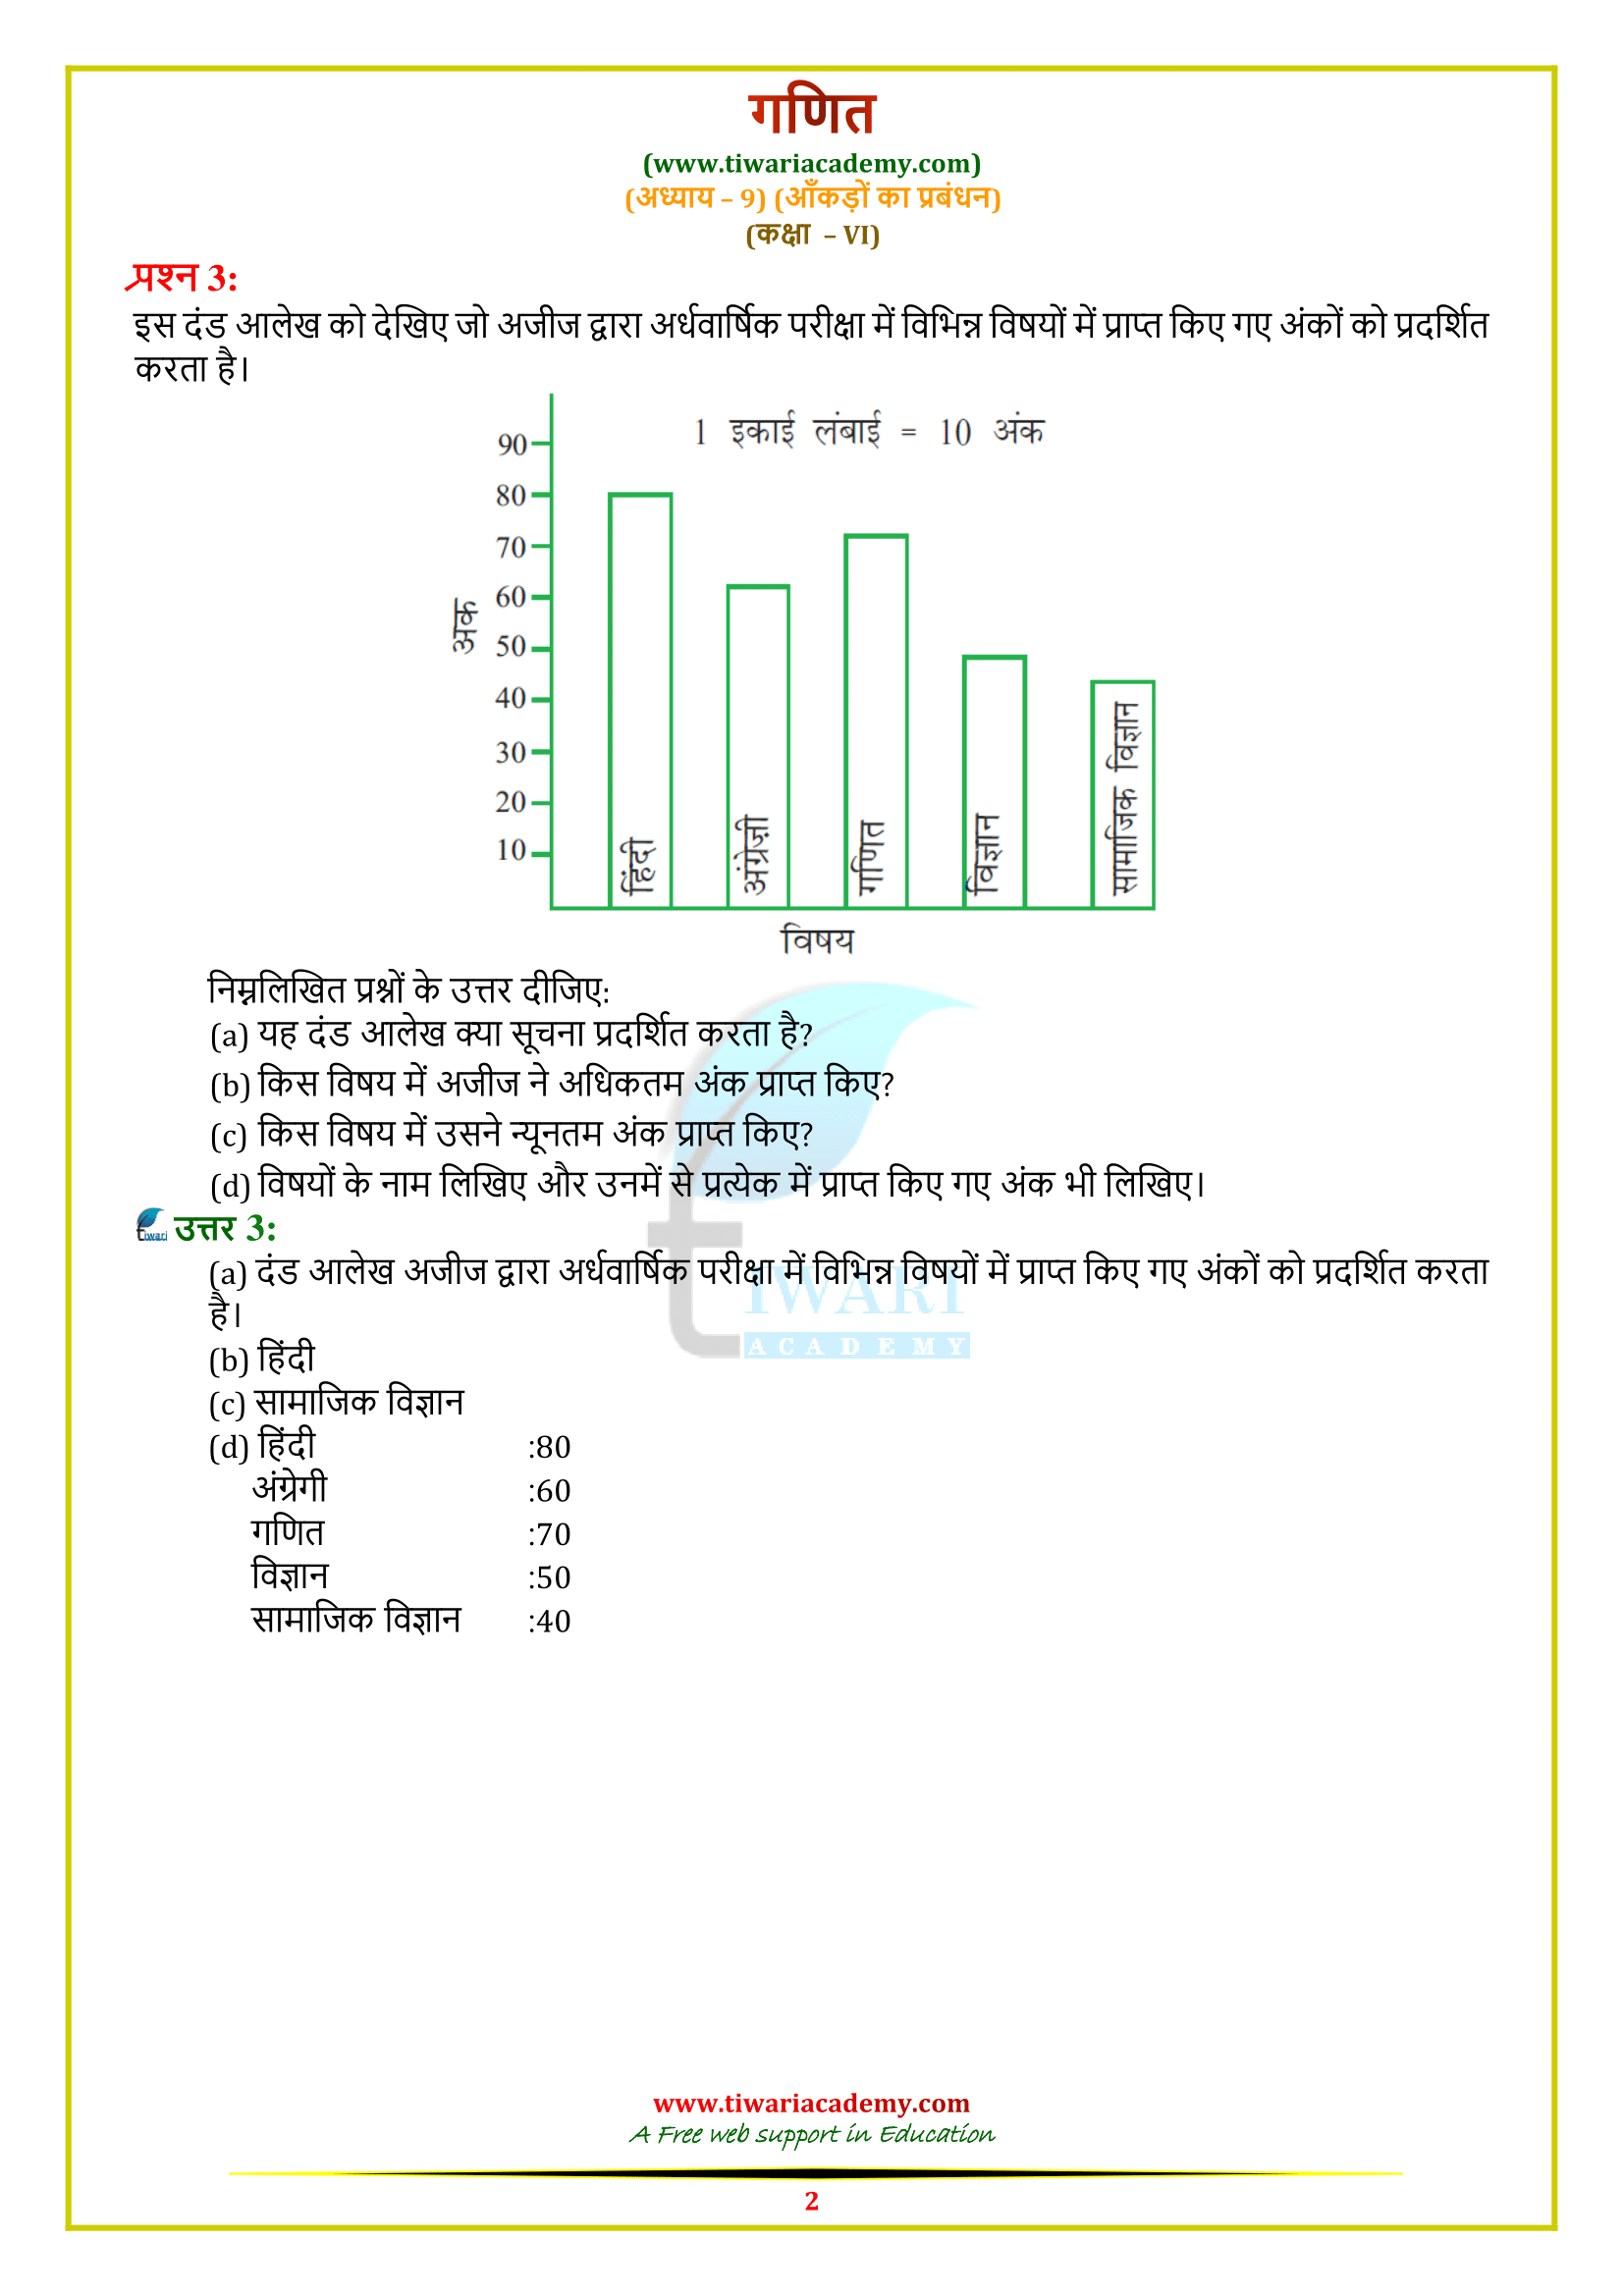
6th Maths Exercise 9.3 Solutions in Hindi and English Medium
Class 6 Maths Chapter 9 Exercise 9.3 Solution
Class VI Mathematics Ex. 9.3 of NCERT (https://ncert.nic.in/) Book chapter 9 Data Handling in PDF file format free to download or use as it is without downloading. All the contents are updated for CBSE session 2024-25. Students of state boards like UP Board, MP Board, Gujrat Board, etc. can take help from these solutions free of cost. In exercise 9.3 of class 6 math we will learn to draw Bar graphs and their observations.
| Class: 6 | Mathematics |
| Chapter: 9 | Exercise: 9.3 |
| Topic: | Data Handling |
| Content Mode: | Text and Videos Format |
| Medium: | Hindi and English Medium |
Bar Graph
A bar graph is a pictorial representation of numerical data in the form of rectangles (or bars) of equal width and varying heights with equal spacing between them.
Download App for Class 6


Class 6 Maths Exercise 9.3 Extra Question with Answer
What is bar graph?
A bar chart is a graph with rectangular bars. The graph usually compares different categories. For example, if you had two houses and needed budgets for each, you could plot them on the same x-axis with a grouped bar chart, using different colors to represent each house.
What are the uses of bar graph?
a Bar Graph. Bar graphs are used to compare things between different groups or to track changes over time. However, when trying to measure change over time, bar graphs are best when the changes are larger.
Reading and Interpretation of a Bar Graph
The first step in reading a bar graph is to know what it represents or what is the information given by it. For this, we read the captions which are generally written just below the horizontal line and adjacent to vertical line.
Class 6 Maths Exercise 9.3 Important Questions
What information is given by the bar graph?
Bar graphs are ideal for comparing two or more values, or values over time. Data is displayed either horizontally or vertically. Single bar graphs are used to convey discrete values of an item within a category. For instance, a bar graph could display the number of males with a certain trait for specific ages.
What is a histogram vs bar graph?
Histograms are used to show distributions of variables while bar charts are used to compare variables. Histograms plot quantitative data with ranges of the data grouped into bins or intervals while bar charts plot categorical data.
How are graphs used in everyday life?
Graphs are used in everyday life, from the local newspaper to the magazine stand. It is one of those skills that you simply cannot do without. Whatever your need or calculation, if used correctly, a graph can help you and make your life simpler. A graph can help you keep track of things and to be on top of your game.
After knowing that what does a bar graph represent, we read the scale so that we can know the precise values in the given data.
After reading a bar graph one must be able to draw certain conclusions from it. Drawing some conclusions from a given bar graph means interpretation of the bar graph.
What is prime use of the concept of bar graph given in exercise 9.3 of 6th standard NCERT Maths?
Representing data by pictograph is a very time-consuming method and sometimes difficult too. So, we see some other way of representing data visually.
Bars of uniform width can be drawn horizontally or vertically with equal spacing between them and then the length of each bar represents the given number. Such a method of representing data is called a bar diagram or a bar graph.
Is exercise 9.3 of 6th standard Maths easy?
Exercise 9.3 of 6th standard Maths is not easy and not complicated. It lies in the middle of easy and hard because students get stuck in some parts of given questions. But difficulty level of any exercise varies from student to student. So, exercise 9.3 of 6th standard Maths is easy or not depends on students also. Some students find it hard, some find it easy, and some find it in the mid of easy and complex.
Can children complete exercise 9.3 of 6th standard Maths just in 2 days?
Children can complete exercise 9.3 of 6th standard Maths in 2 days or not depends on children’s working efficiency, dedication towards work, working speed, ability, and many other factors. But if children give 1 hour per day to this exercise then, they can easily complete exercise 9.3 of class 6th Maths in 2 days because this exercise is very short.
How can students score full marks in exercise 9.3 of 6th Maths?
In exercise 9.3 of 6th standard Maths, there are 4 sums (3 questions and one example (example 9)). All problems of this exercise are good and interesting. All sums of this exercise are equally significant. To score full marks in exercise 9.3 of 6th standard Maths, students must practice all questions of this exercise.