on November 4, 2023, 11:58 AM
NCERT Solutions for Class 9 Maths Exercise 14.4 Statistics updated for new academic session in Hindi and English Medium. Get the latest Tiwari Academy’s NCERT Solutions for Class 9 Maths, Exercise 14.4 on Statistics, perfectly updated for the new academic session. Available in both Hindi and English to cater to all students’ needs.
NCERT Solutions for Class 9 Maths Exercise 14.4
NCERT (https://ncert.nic.in/) Textbook of Class 9 Maths Exercise 14.4 is solved in Hindi and English. Students can take help from the PDF and video solutions for better understanding. Study material and test papers based on chapter 14 are also given here to download.
Plotting the point for Histogram
A histogram method is used just like the bar graph to represent quantitative data. A histogram shows one quantitative variable on the x-axis and the frequency of that variable on the y-axis. The distinguishing quality of a histogram is that data is grouped as Bins. Which are intervals on the x-axis.
Frequency Polygons
Like the other ways of representing data, it is also used to represent the distributions of data graphically. However, the major feature that set it apart, comparing histograms. Frequency polygon considers midpoints of the class intervals and rather than showing class intervals on the horizontal axis clearly showing its upper and lower limit like shown in the examples of 9th Maths NCERT Book exercise 14.4.
| Class: 9 | Mathematics |
| Chapter: 14 | Exercise: 14.4 |
| Topic: | Statistics |
| Content: | Exercise Solution |
| Medium: | Hindi and English Medium |
Application of Graphical Representation
Class 9 Maths chapter deals with the frequency polygons with data in equal interval. An understanding of frequency polygon is important because you are supposed to use the formulae to bring the information on the graph. We suggest you check and practice all the examples given below the paragraph to have a concrete understanding of the concept.
The important topic of the chapter 14
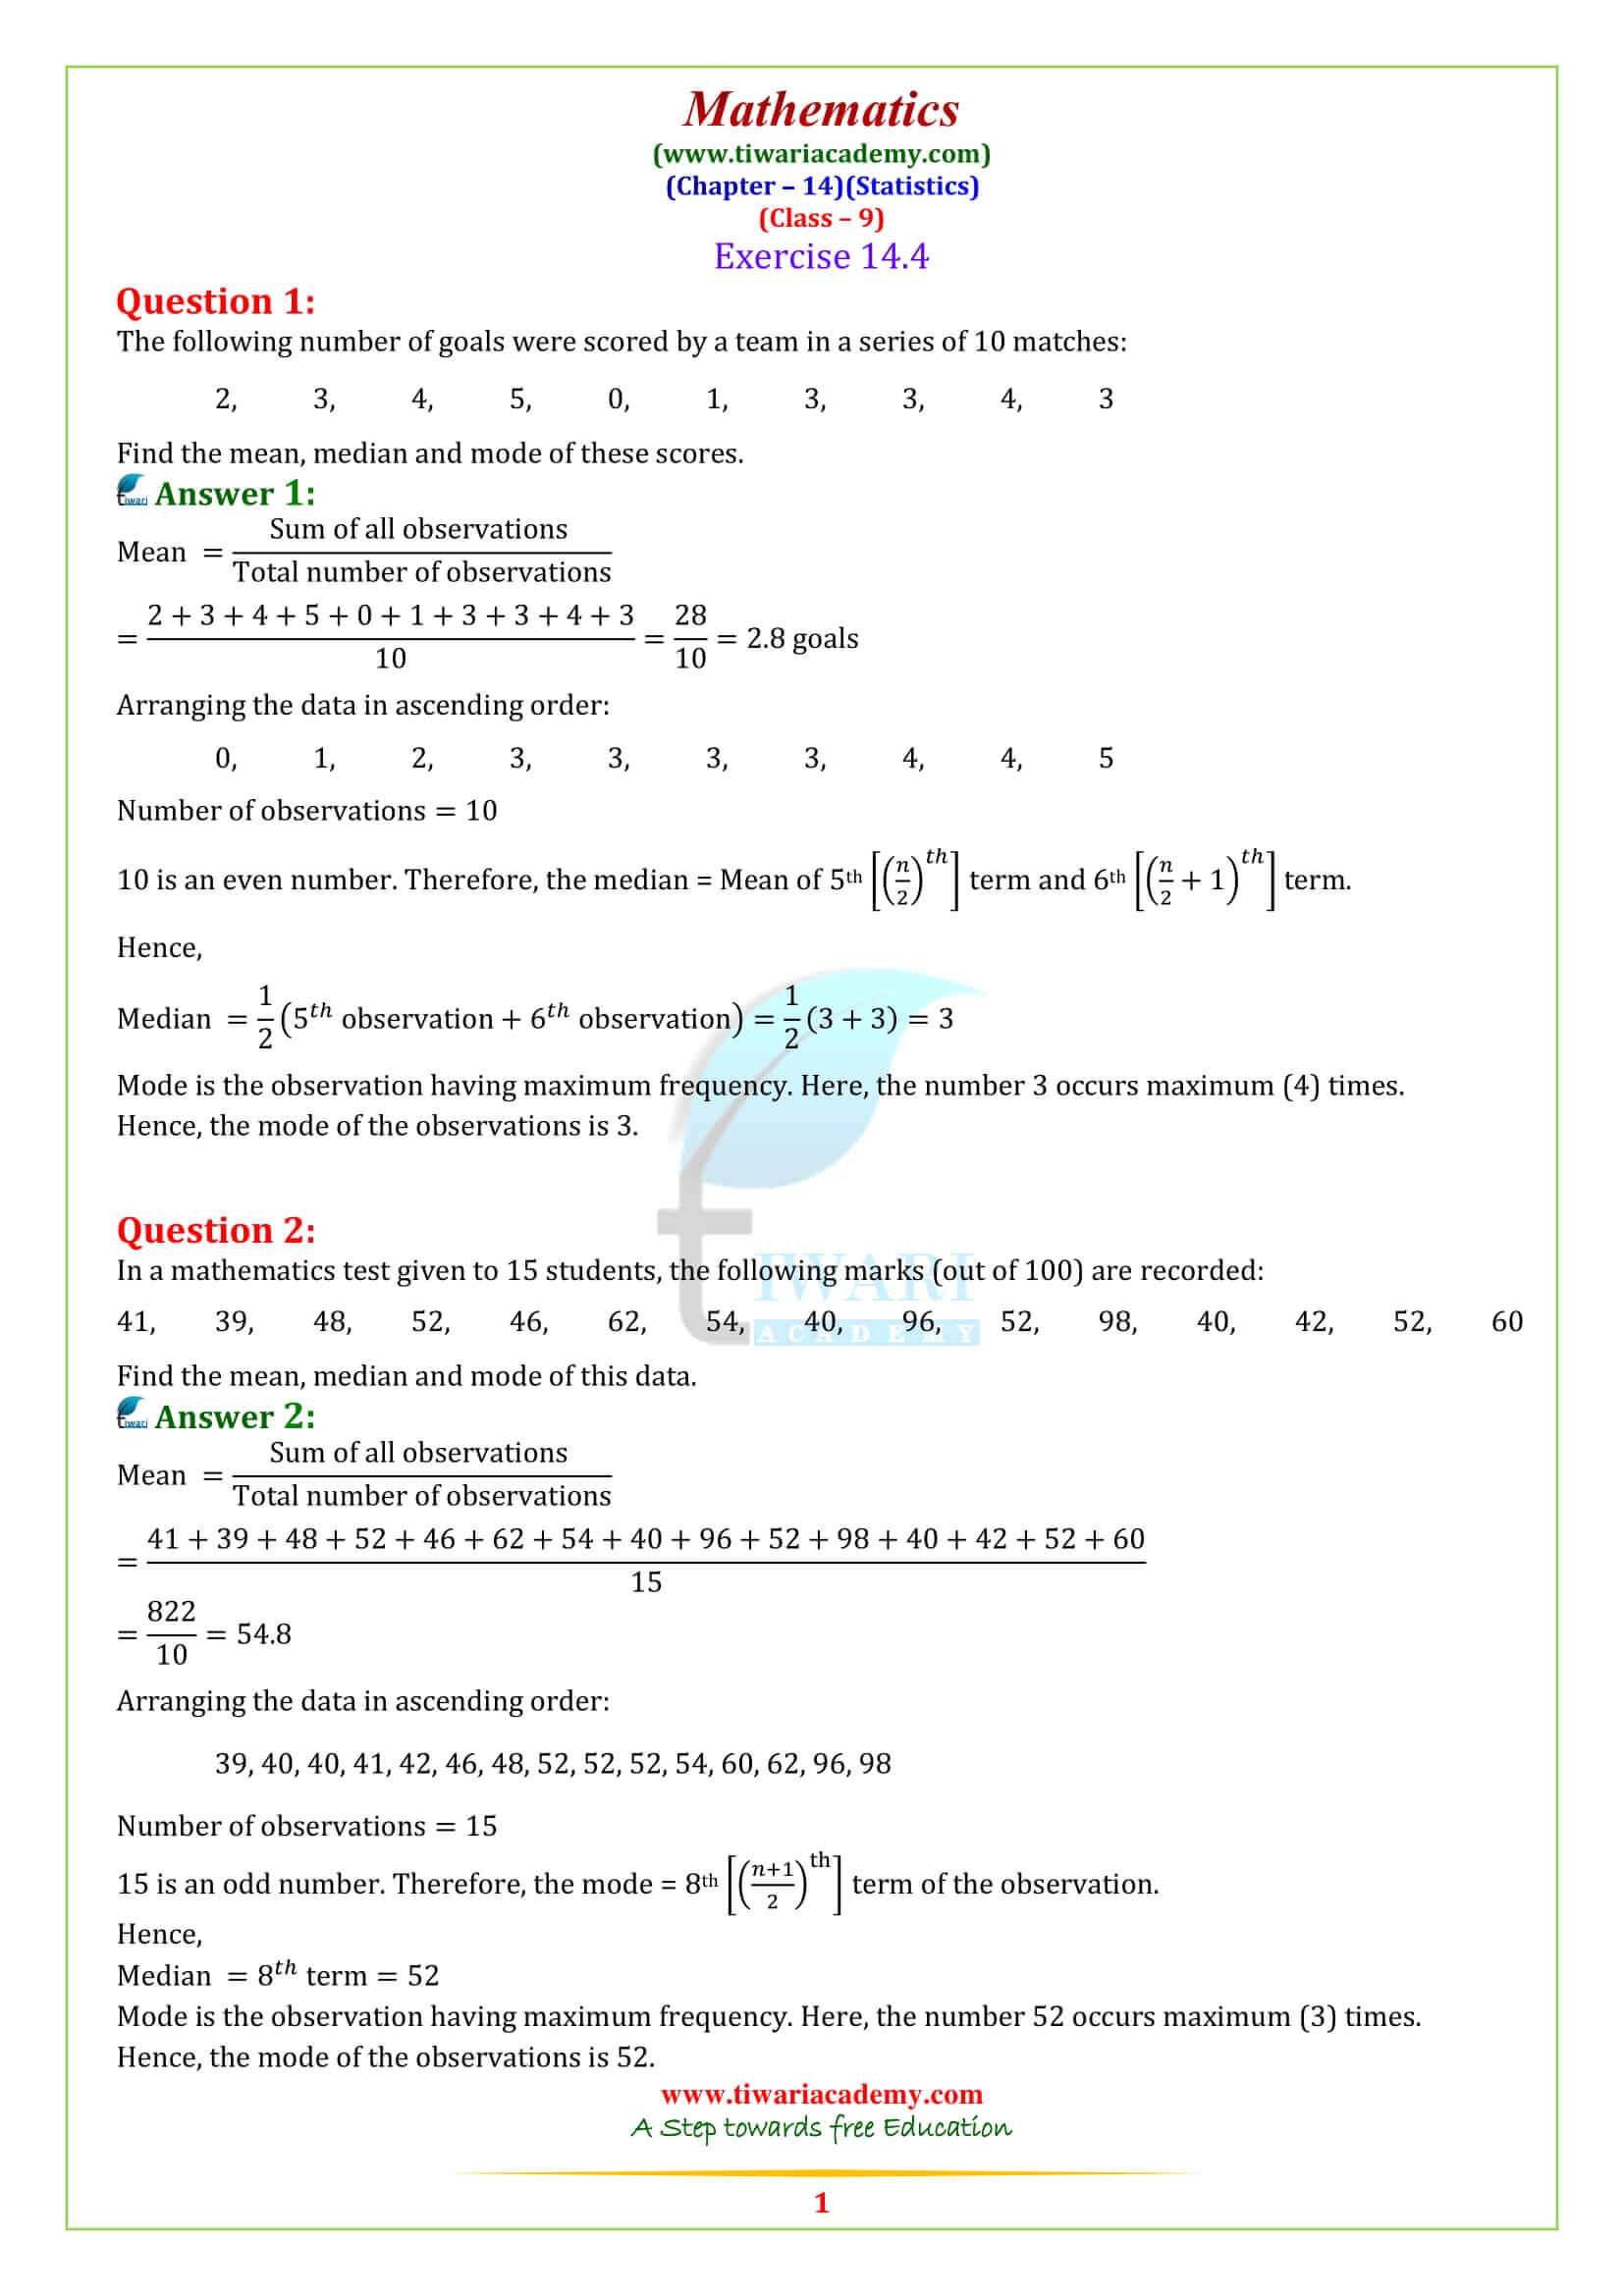
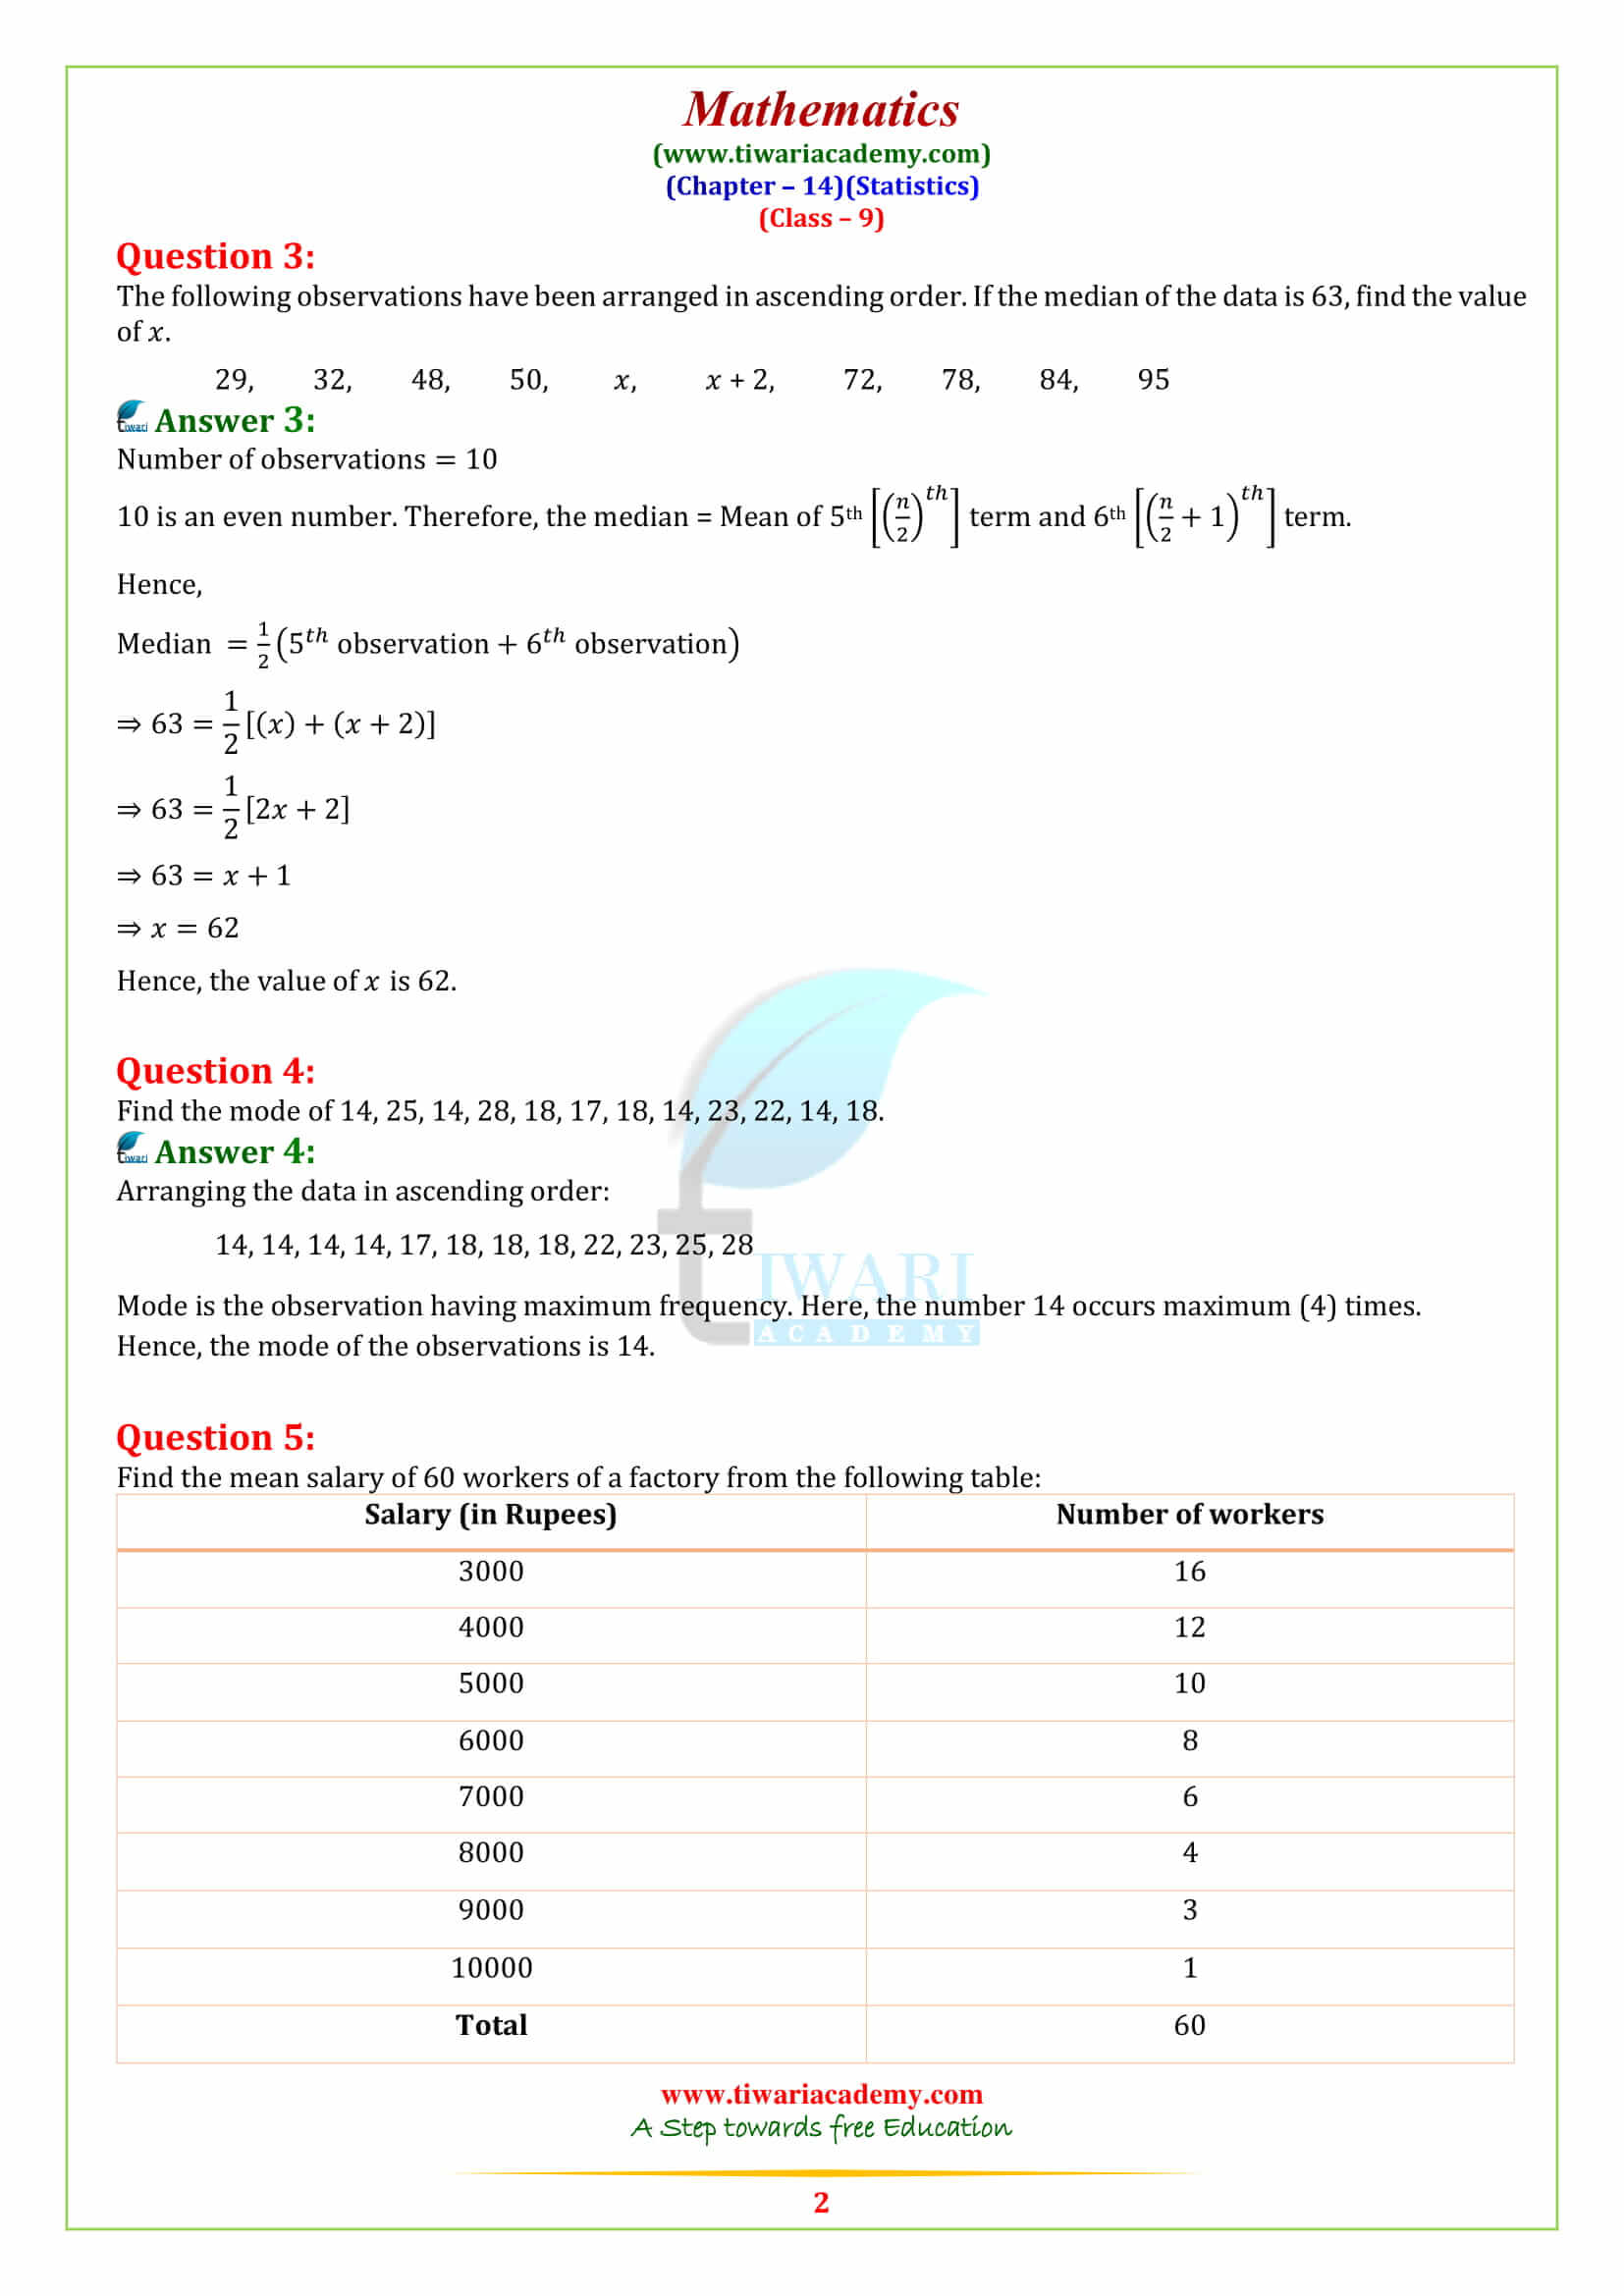
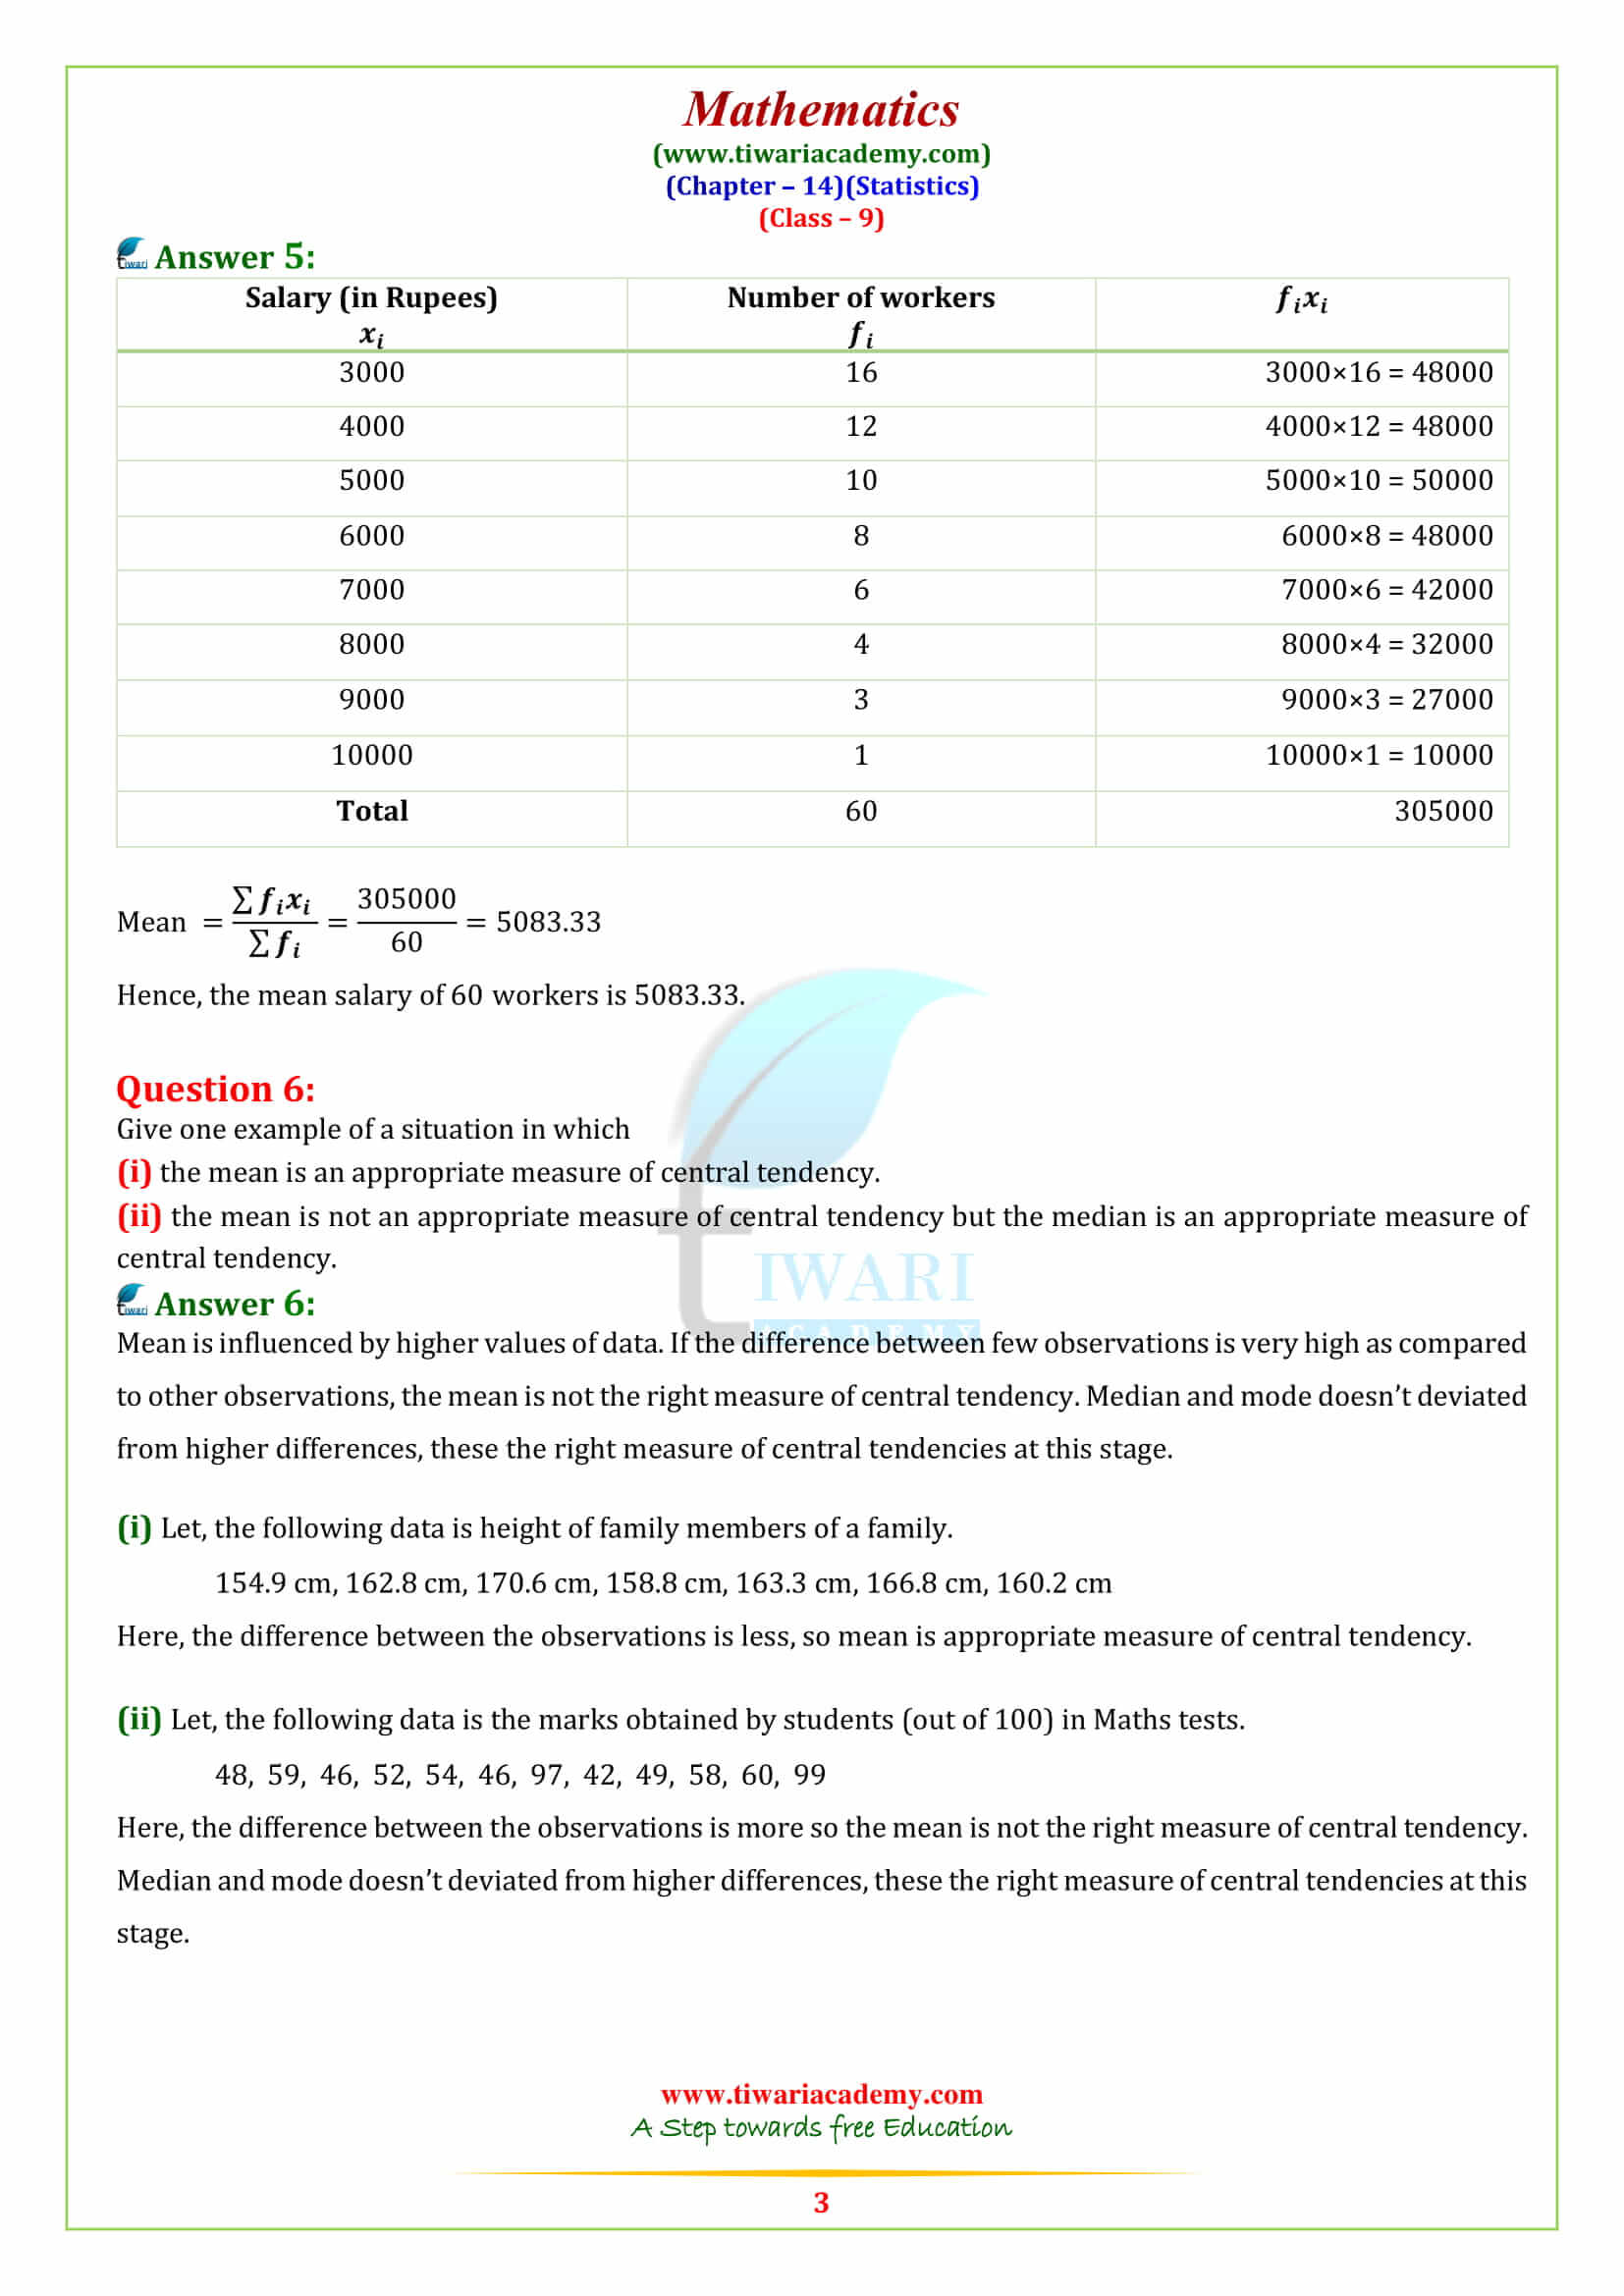
The last topic is measures of central tendency are among some of the vital concepts of the statistics chapter 14. It is a single value that efforts to describe a set of data by recognizing the central position within that group of data.
You have to keep in mind that sometimes the measure of central tendency also called a measure of a central location in the examination to twist the questions. They are also been seen as the summary of data/ statistics.
You must be aware of mean as the main central tendency but there are others too, like Median, Mode and Mean. Here Mean is the average and the number of observations is the sum of values of all observations divided by the total number of observations.