by Tiwari Academy
NCERT Solutions for Class 5 Maths Mela Chapter 15 Data Through Pictures updated for Session 2025-26. Class 5 Maths Mela introduces students to the concept of data handling using pictographs. The chapter helps children collect data, organize it and represent it through pictures and symbols. Students learn to read pictorial data, compare quantities, answer questions and draw conclusions. Key concepts include pictographs, data collection, frequency, comparison and interpretation, making mathematics easy, visual and interesting for young learners.
Class 5 Maths Mela Chapter 15 Solutions
Class 5 Maths Mela Chapter 15 MCQ
Class 5 Math Magic Chapter 15 Solutions
Class 5 Maths all Chapters Solutions
Data Through Pictures Class 5 Maths Mela Chapter 15 Solutions
Page 179
Child TV Reporter
Look at the table and answer the following questions.

1. How many children watch TV for more than half an hour?
Answer:
Total number of children = 35
Number of children watch TV ½ hour = 9
Number of children watch TV for more than half an hour: 35 – 9 = 26
2. How many children watch TV for less than two hours?
Answer:
Number of children watch TV ½ hour = 9
Number of children watch TV 1 hour = 13
Number of children watch TV 1½ hour = 7
Number of children watch TV less than two hours = 9 + 13 + 7 = 29 children
3. The number of children who watch TV for more than two hours is ________.
Answer:
Number of children who watch TV for more than two hours = 3
4. More children watch TV for two hours than half an hour. (True/False)
Answer:
The statement is false.
Number of children watch TV ½ hour = 9
Number of children watch TV 2 hour = 3
So, More children watch TV for half an hour than two hours
Class 5 Maths Mela Chapter 15 Topic – Stock-Taking in a Shop
Page 180
Stock-Taking in a Shop
Dipesh used a scale while recording the items in the pictograph. A scale helps record a large number of things using fewer icons.
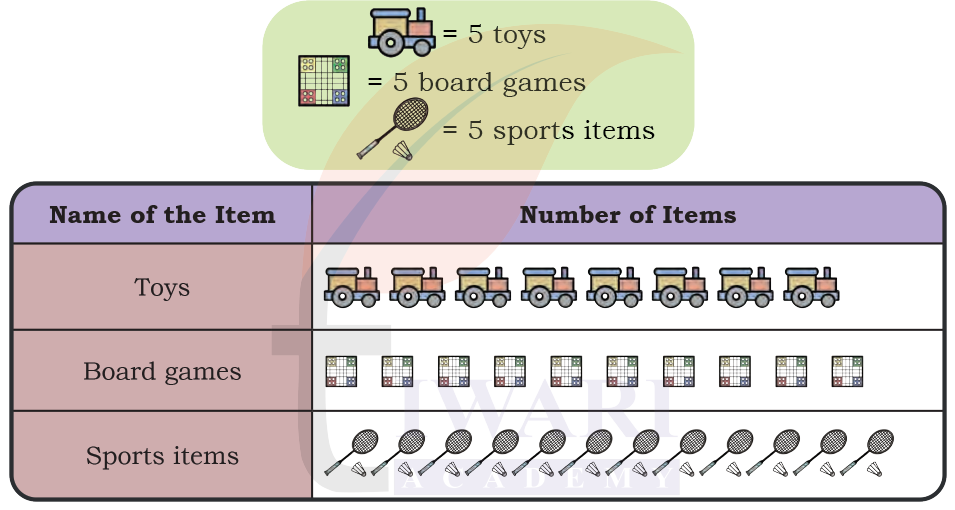
Now, answer the following questions based on the above pictograph.
(1) How many toys does Joseph Uncle have? __________
(2) How many board games does Joseph Uncle have? __________
(3) How many total play items does Joseph Uncle have? __________
Is there any other scale that you can use to make the pictograph? Choose your scale and show the same data using a pictograph in your notebook.
Answer:
Given that 1 icon = 5 items
(1) Toys: 8 tractor icons.
Total toys = 8 × 5 = 40
(2) Board games: 10 board game icons.
Total board games = 10 × 5 = 50
(3) Sports items: 12 racket icons.
Total sports items = 12 × 5 = 60
Total play items = 40 + 50 + 60 = 150
Page 181
Two-wheelers on the Road
Deepti noted down the number of two-wheelers passing her house in one hour on three different days. She used one icon to show 3 two-wheelers.
Observe the pictograph and answer the following questions.
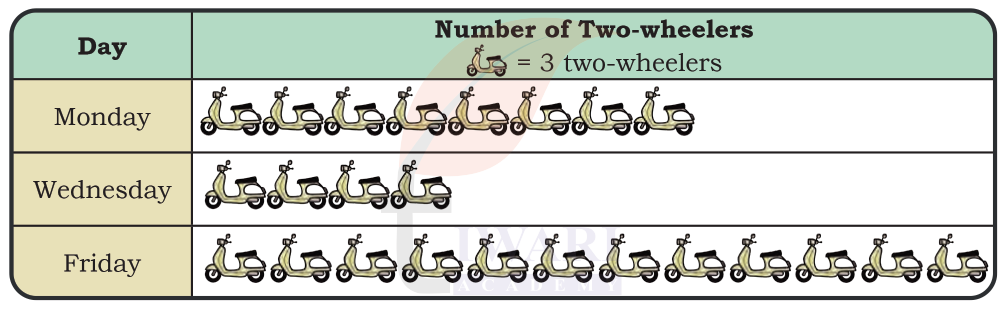
1. Which day had the most two-wheelers passing her house? _______
2. How many total two-wheelers did she record over three days? _______
3. How many fewer two-wheelers were seen on Wednesday than on Monday? _______
4. How many more two-wheelers were seen on Friday than on Wednesday? _______
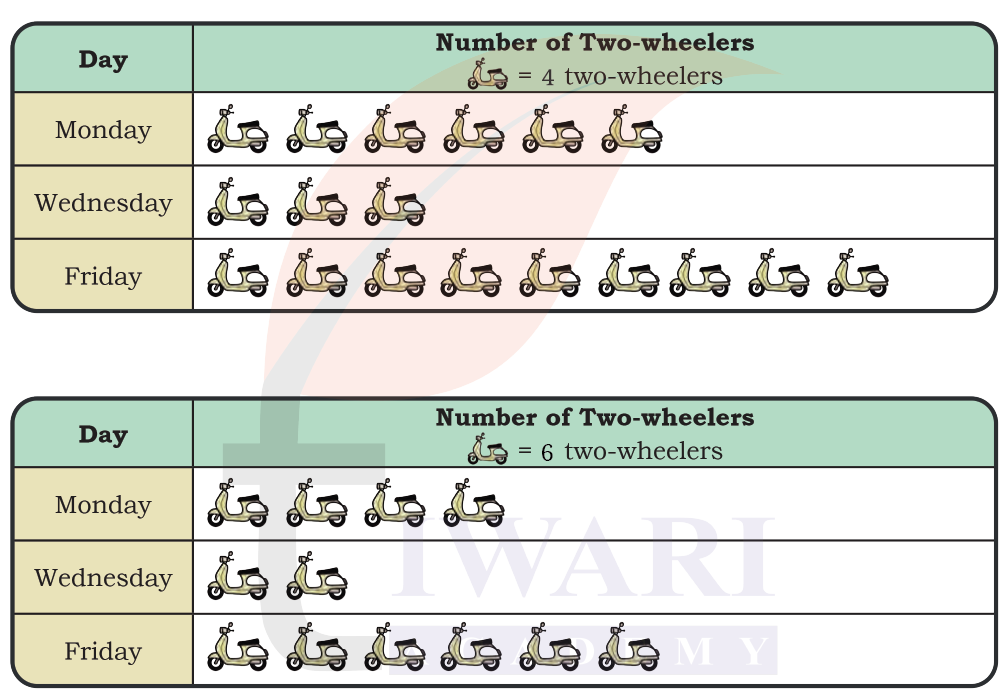
5. Choose any other scale and represent the same data using a pictograph in your notebook.
Answer:
Counting the icons:
Monday: 8 icons
Wednesday: 4 icons
Friday: 12 icons
Applying the scale (1 icon = 3 two-wheelers):
Monday: 8 × 3 = 24 two-wheelers
Wednesday: 4 × 3 = 12 two-wheelers
Friday: 12 × 3 = 36 two-wheelers
1. Friday had the most two-wheelers passing her house(36 two-wheelers).
2. Total two-wheelers she record over three days = 24 + 12 + 36 = 72 two-wheelers
3. Two-wheelers on Wednesday = 12
Two-wheelers on Monday = 24
= 24 – 12 = 12 fewer two-wheelers
4. Two-wheelers on Friday = 36
Two-wheelers on Wednesday = 12
Difference = 36 – 12 = 24 more two-wheelers
5.
Class 5 Maths Mela Chapter 15 Topic – Recording a Day
Page 182
Recording a Day
One day Raman and Sheela decided to record how they spent their day.
Raman recorded his daily routine in the table below.
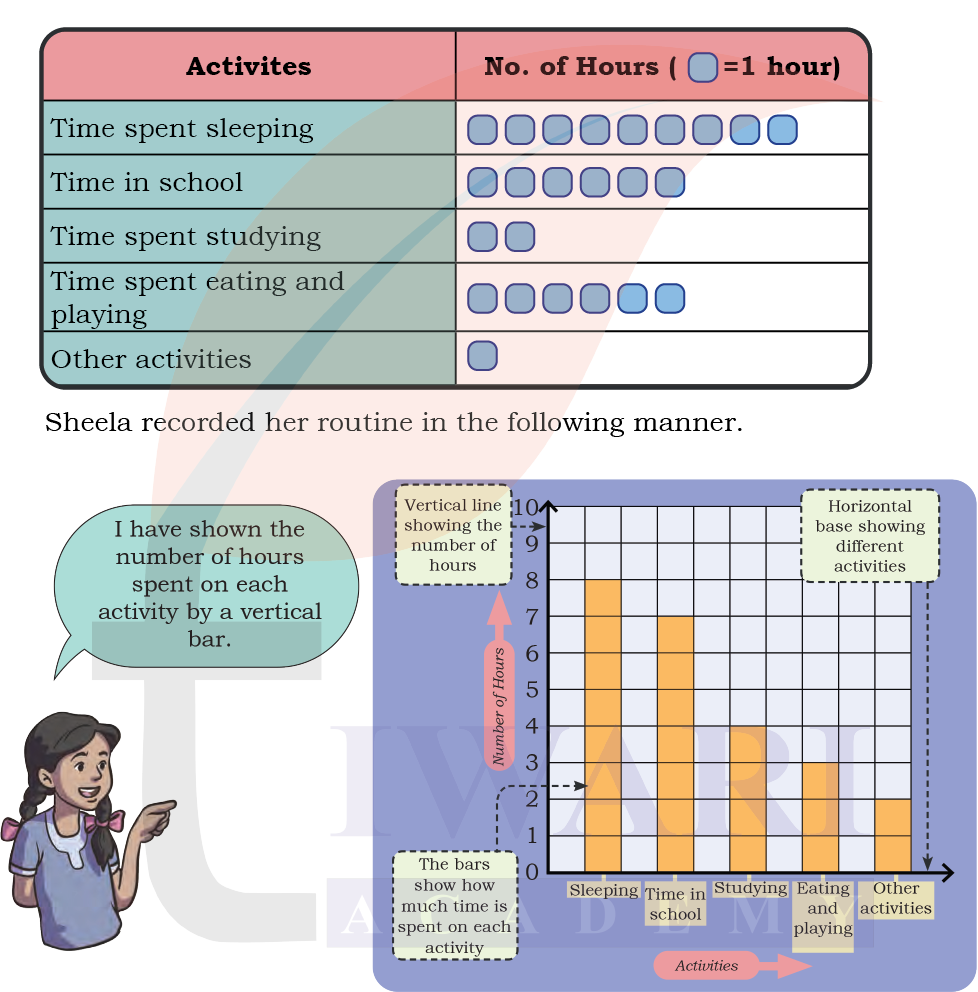
How is Sheela’s recording different from Raman’s recording? Discuss in class. Sheela’s way of recording the data is called a bar graph.
Answer:
Raman records his routine using pictorial symbols (icons representing hours).
Each blue square represents 1 hour of an activity and this is visually shown in the table format.
Sheela uses a bar graph to represent the data.
She shows the number of hours spent on each activity using vertical bars.
The height of each bar corresponds to the number of hours spent on that activity.
Observe Raman’s and Sheela’s routines and answer the following questions.
1. Whose daily routine shows more time spent on sleeping? _______
Answer:
Time spent by Raman on sleeping = 9 hours
Time spent by Sheela on sleeping = 8 hours
Raman spent more time on sleeping than Sheela.
2. Who spends more hours in the school? _______
Answer:
Time spent by Raman in the school = 6 hours
Time spent by Sheela in the school = 7 hours
Sheela spent more time in the school than Raman.
3. How many more hours does Sheela spend studying compared to Raman? _______
Answer:
Time spent by Raman on studying = 2 hours
Time spent by Sheela on studying = 4 hours
Extra hour spent by Sheela than Raman on studying = 4 – 2 = 2 hours
4. Is there any activity on which they spend the same amount of time? If yes, name the activity _______
Answer:
No, there is not any activity on which they spend the same amount of time.
5. Based on their data, whose routine do you think is more balanced? Why? _______
Answer:
I think Sheela’s routine is more balanced because she spends a relatively even amount of time on various activities, whereas Raman’s routine has a heavy focus on sleeping, with less time allocated for studying or other activities.
Class 5 Maths Mela Chapter 15 Topic – Day in My Life
Page 183
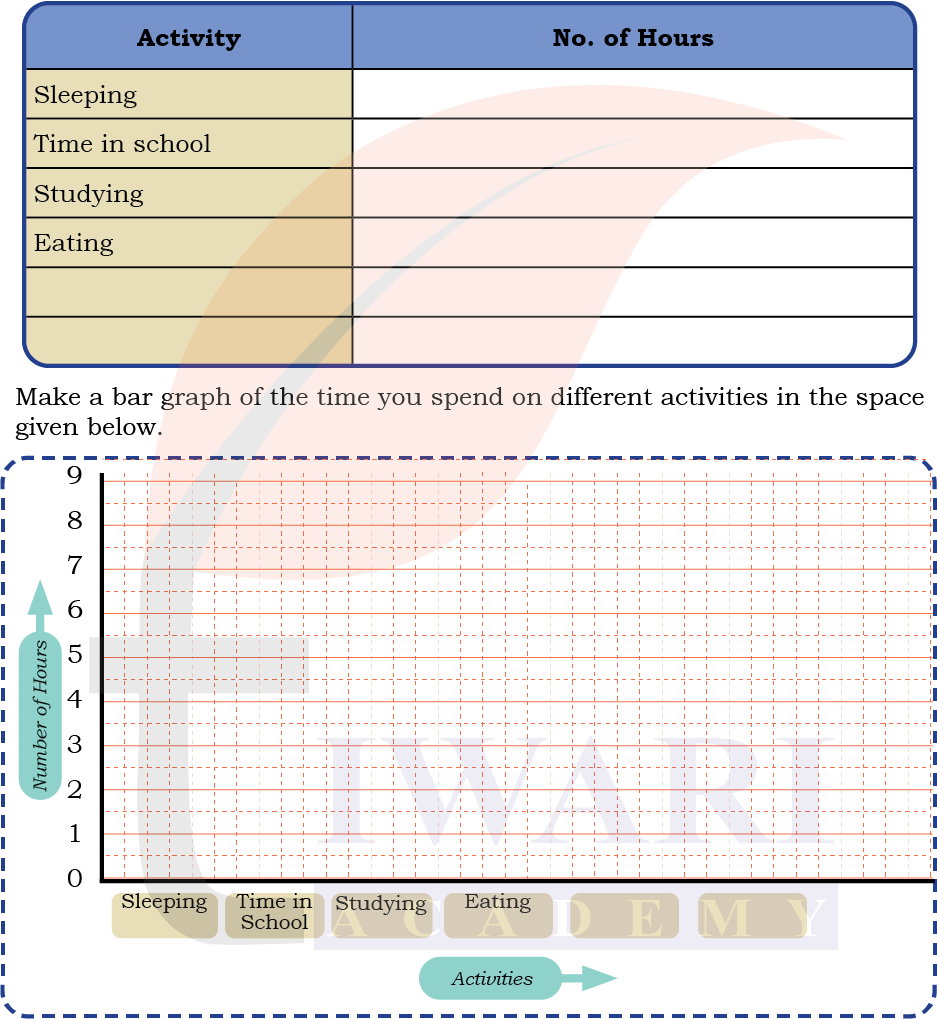
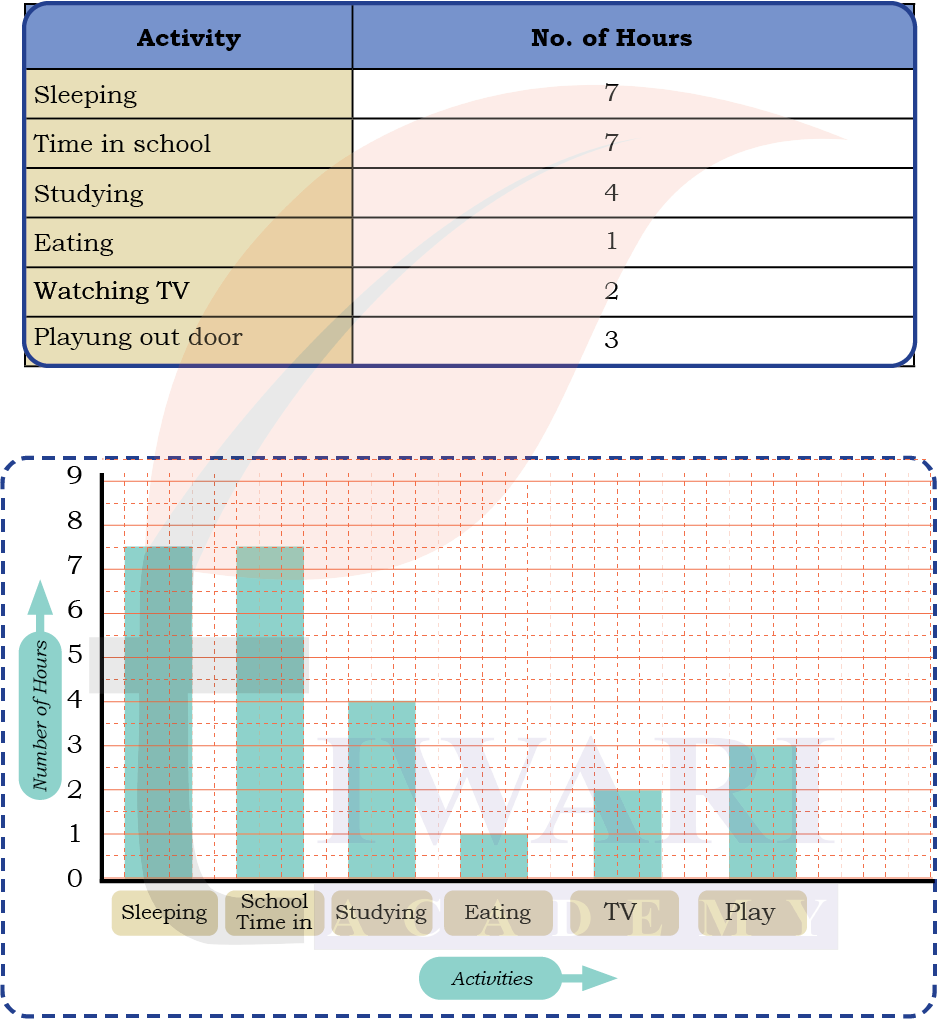
Day in My Life
Record your daily routine (24 hours) in hours and minutes, as necessary. Note the time spent on activities like sleeping, studying, playing, eating, and others.
Answer:
Page 184
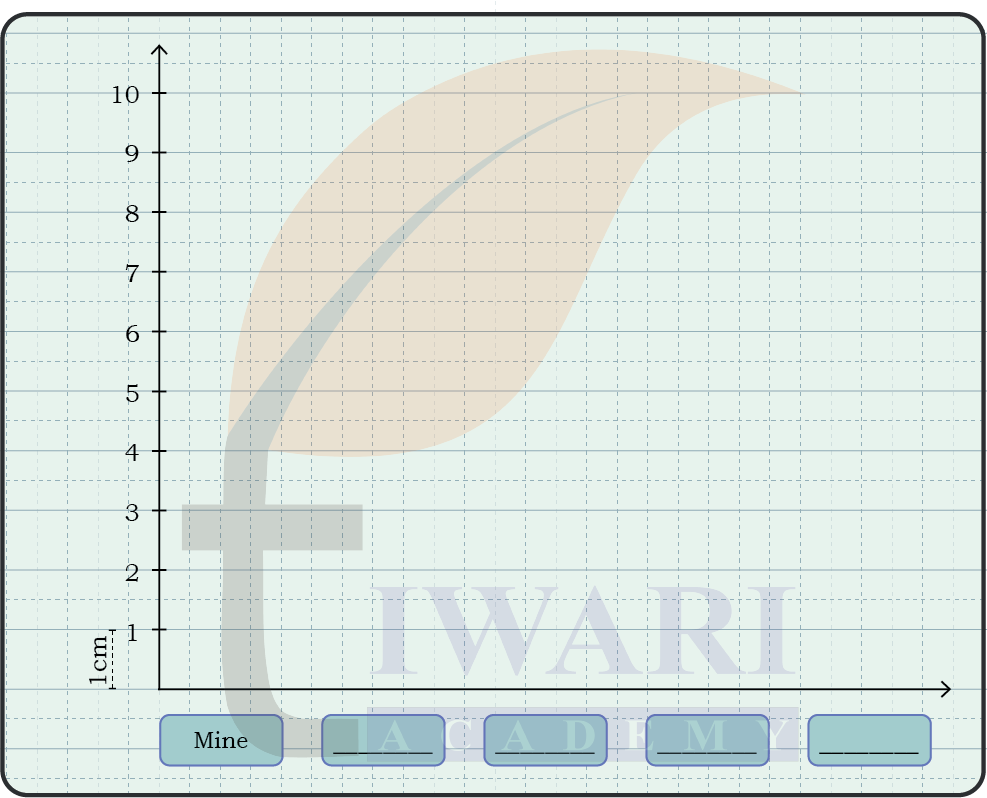
Whose Index Finger is Longer?
Cut long paper strips from waste paper. Give one strip (each of the same width) to each of your friends. Now, put the paper strip on your index finger and tear off the extra strip extending above your fingers.
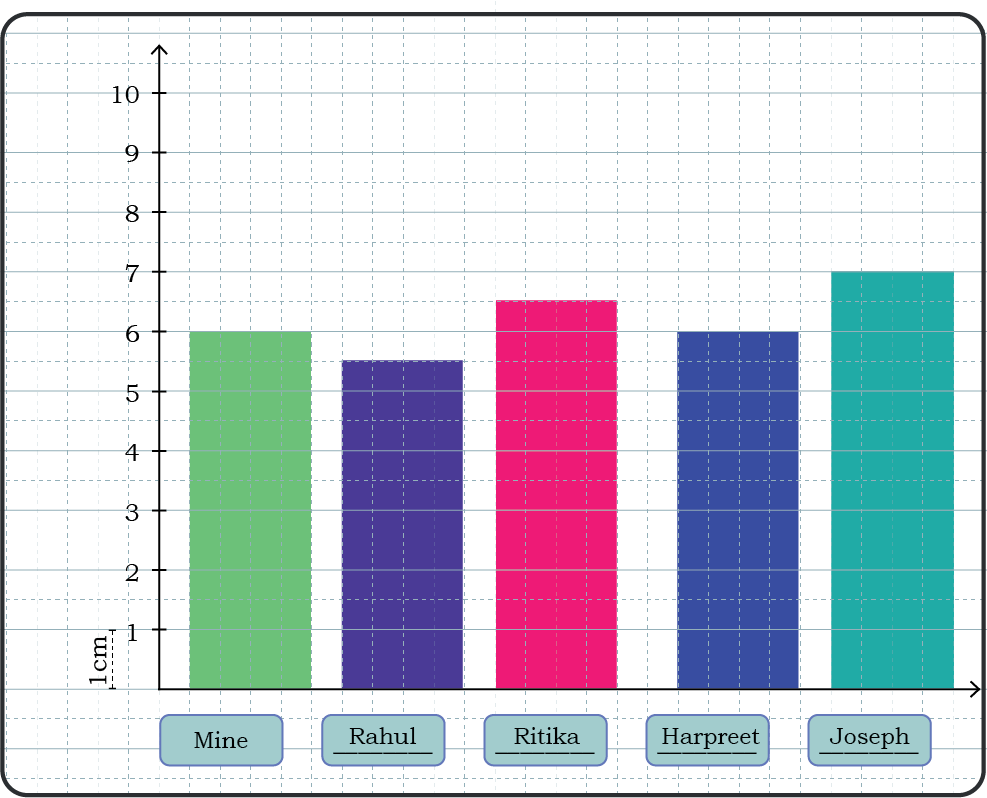
Paste these paper strips along the horizontal line in the given bar graph.
Write the answers to the following questions based on your graph.
1. Whose index finger is the longest? _______ .
2. The length of the longest index finger is _______ cm.
3. The smallest index finger is _______ cm long.
4. It belongs to _______.
Answer:
1. Joseph’s index finger is the longest one.
2. The length of the longest index finger is 7 cm.
3. The smallest index finger is 5.5 cm long.
4. It belongs to Rahul (my best friend).
Class 5 Maths Mela Chapter 15 Topic – Food Wastage in the School Canteen
Page 185
Food Wastage in the School Canteen
Rani stays in a residential school. Her school’s dining hall displays the amount of food wasted and the number of children the food could have fed.
Given below is the data collected over the weekdays for different food items.
Rani was shocked to see the data. What do you think about food wastage?
How can we reduce the wastage of food?
Answer:
Thoughts on Food Wastage: This data is quite concerning 30 kg of food wasted in just one week could have fed 90 children.
We can reduce food wastage by following the given below steps:
► Serve smaller portions initially and offer seconds if needed
► Ask children about their food preferences
► Improve the taste and presentation of less popular items like Khichdi
► Create awareness about the importance of not wasting food
► Plan meals according to children’s preferences.
What can we do with the leftover food?
Answer:
We can take steps for leftover food:
► Donate to local shelters or food banks
► Compost vegetable waste for gardens
► Share with community members in need
► Use leftovers creatively in the next meal (if food safety permits)
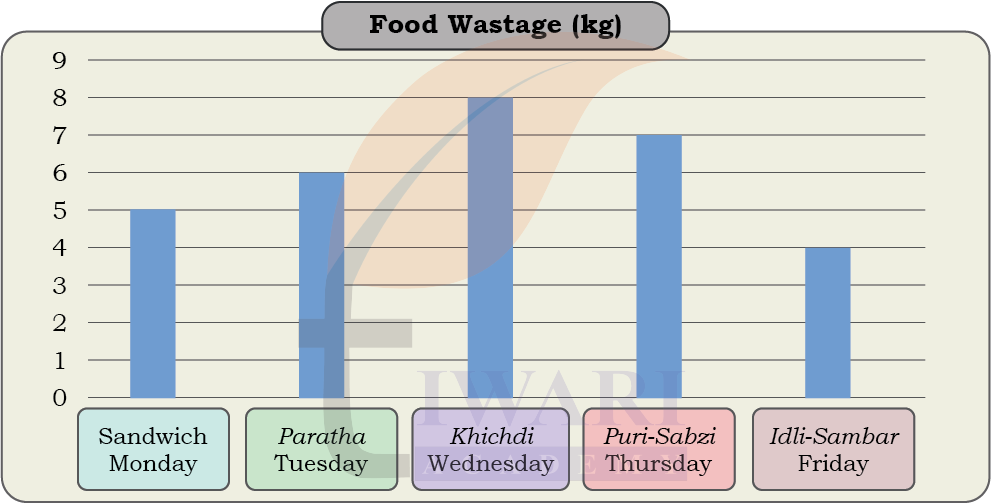
Observe the above graph and answer the following questions.
1. Which food item had the highest amount of wastage? _______
2. Which food item had the least amount of wastage? _______
3. How much total food wastage was recorded in these days? _______
4. If 1 kg of food waste can feed 3 children, how many children could have been fed with the total food wasted? _______
5. _______ day had less food wastage than _______ day.
6. If the same food items are to be repeated next week, can you predict which food item is likely to be wasted the most?
Answer:
Looking at the bar graph, the food wastage data:
Sandwich (Monday): 5 kg
Paratha (Tuesday): 6 kg
Khichdi (Wednesday): 8 kg
Puri-Sabzi (Thursday): 7 kg
Idli-Sambar (Friday): 4 kg
1. Khichdi (Wednesday) had the highest wastage at 8 kg.
2. Idli-Sambar (Friday) had the least wastage at 4 kg.
3. Total food wastage = 5 + 6 + 8 + 7 + 4 = 30 kg.
4. Children could have been fed with the total food wasted = 30 kg × 3 children per kg = 90 children.
5. Friday had less food wastage than Monday day (or any other day except Friday itself).
6. Khichdi is likely to be wasted the most, as it had the highest wastage (8 kg) this week, suggesting children may not prefer it as much as other items.
Page 187
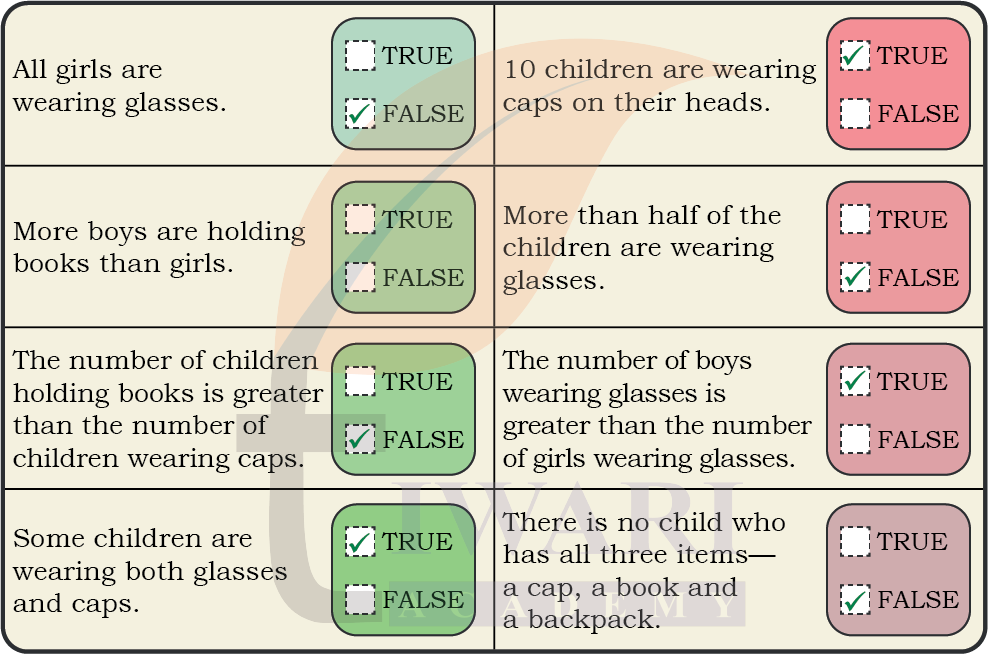
True or False
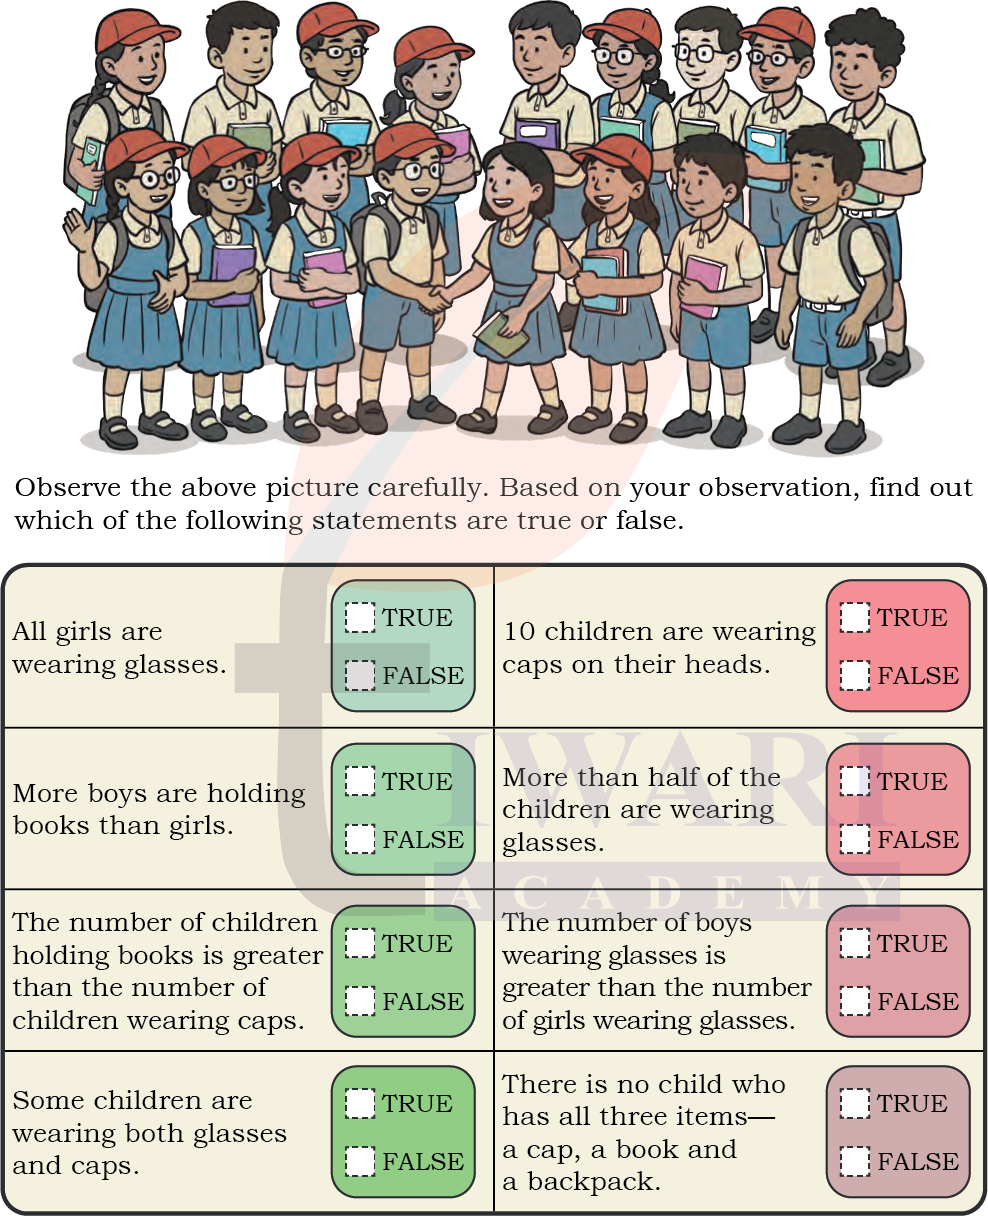
Answer: