



by Tiwari Academy Team
NCERT Solutions for Class 7 Maths Ganita Prakash Part 2 Chapter 5 Connecting the Dots, prepared as per the latest CBSE syllabus 2026-27. The chapter introduces statistics through relatable examples, teaching students to identify statistical questions, calculate mean and median, spot outliers and read dot plots and double bar graphs. All in-text questions and “Figure it Out” exercises are solved step by step, helping students understand data handling concepts clearly and prepare confidently for school exams.
NCERT Class 7 Maths Ganita Prakash Part 2 Chapter 5 Solutions
Page 101 – Figure it Out
1. Shreyas is playing with a bat and a ball but not cricket. He counts the number of times he can bounce the ball on the bat before it falls to the ground. The data for 8 attempts is 6, 2, 9, 5, 4, 6, 3, 5. Calculate the average number of bounces of the ball that Shreyas is able to make with his bat.

Answer:
Given data: 6, 2, 9, 5, 4, 6, 3, 5
Sum = 6 + 2 + 9 + 5 + 4 + 6 + 3 + 5 = 40
Number of values = 8
Mean = Sum of all the values/Number of values
Mean = 40/8
Mean = 5
The mean (average) number of bounces is 5.
2. Try the activity above on your own. Collect data for 7 or more attempts and find the average.
Answer:
Data (7 attempts):
Attempt 1: 8 bounces
Attempt 2: 5 bounces
Attempt 3: 12 bounces
Attempt 4: 6 bounces
Attempt 5: 9 bounces
Attempt 6: 7 bounces
Attempt 7: 11 bounces
Sum of all values: 8 + 5 + 12 + 6 + 9 + 7 + 11 = 58
Total attempts = 7 (Number of values)
Mean = Sum of all values ÷ Number of values
Mean = 58 ÷ 7
Mean = 8.29
3. Identify a flowering plant in your neighbourhood. Track the number of flowers that bloom every day over a week during its flowering season. What is the average number of flowers that bloomed per day?
Answer:
Plant chosen: Hibiscus plant in my garden
Data collected (7 days):
Day Number of flowers that bloomed
- Monday 3 flowers
- Tuesday 5 flowers
- Wednesday 4 flowers
- Thursday 6 flowers
- Friday 4 flowers
- Saturday 5 flowers
- Sunday 3 flowers
Sum of all values: 3 + 5 + 4 + 6 + 4 + 5 + 3 = 30 flowers
Total days = 7
Mean = Sum of all values ÷ Number of values
Mean = 30 ÷ 7
Mean = 4.29
The hibiscus plant bloomed an average of about 4 flowers each day during that week.
4. Two friends are training to run a 100 m race. Their running times over the past week are given in seconds — Nikhil: 17, 18, 17, 16, 19, 17, 18. Sunil: 20, 18, 18, 17, 16, 16, 17. Who on average ran quicker?
Answer:
Nikhil’s data: 17, 18, 17, 16, 19, 17, 18
Sum of all values: 17 + 18 + 17 + 16 + 19 + 17 + 18 = 122 seconds
Total attempts = 7
Mean = Sum of all values ÷ Number of values
Mean = 122 ÷ 7
Mean = 17.43 seconds
Sunil’s data: 20, 18, 18, 17, 16, 16, 17
Sum of all values: 20 + 18 + 18 + 17 + 16 + 16 + 17 = 122 seconds
Total attempts = 7
Mean = Sum of all values ÷ Number of values
Mean = 122 ÷ 7
Mean = 17.43 seconds
Both Nikhil and Sunil have the same average running time of 17.43 seconds
Neither ran quicker than the other based on the mean.
5. The enrolment in a school during six consecutive years was as follows: 1555, 1670, 1750, 2013, 2040, 2126. Find the mean enrolment in the school during this period.
Answer:
Data: 1555, 1670, 1750, 2013, 2040, 2126
Sum of all values: 1555 + 1670 + 1750 + 2013 + 2040 + 2126 = 11,154 students
Number of values: Total years = 6
Mean = Sum of all values ÷ Number of values
Mean = 11,154 ÷ 6
Mean = 1,859 students
This means that on average, the school had about 1,859 students enrolled each year during these six consecutive years.
Page 112 – Figure it Out
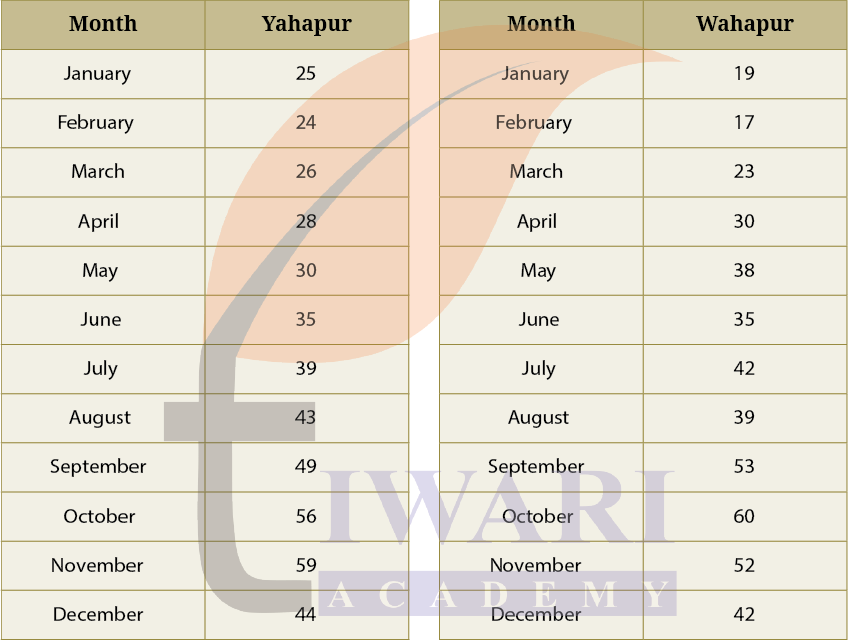
1. Find the median of onion prices in Yahapur and Wahapur.
Answer:
Yahapur prices (in order): 25, 24, 26, 28, 30, 35, 39, 43, 49, 56, 59, 44
Arrange them in increasing order: 24, 25, 26, 28, 30, 35, 39, 43, 44, 49, 56, 59
Number of values = 12 (even number)
Median = Average of the two middle values (6th and 7th values)
6th value = 35
7th value = 39
Median = (35 + 39) ÷ 2 = 74 ÷ 2 = 37
Wahapur prices (in order): 19, 17, 23, 30, 38, 35, 42, 39, 53, 60, 52, 42
Arrange them in increasing order: 17, 19, 23, 30, 35, 38, 39, 42, 42, 52, 53, 60
Number of values = 12 (even number)
Median = Average of the two middle values (6th and 7th values)
6th value = 38
7th value = 39
Median = (38 + 39) ÷ 2 = 77 ÷ 2 = 38.5
2. Sanskruti asked her class how many domestic animals and pets each had at home. Some of the students were absent. The data values are 0, 1, 0, 4, 8, 0, 0, 2, 1, 1, 5, 3, 4, 0, 0, —, 10, 25, 2, — , 2, 4. Find the mean and median. How would you describe this data?
Answer:
Available data (20 values):
0, 1, 0, 4, 8, 0, 0, 2, 1, 1, 5, 3, 4, 0, 0, 10, 25, 2, 2, 4
Sum of all values: 0 + 1 + 0 + 4 + 8 + 0 + 0 + 2 + 1 + 1 + 5 + 3 + 4 + 0 + 0 + 10 + 25 + 2 + 2 + 4 = 72
Total students = 20
Mean = Sum of all values ÷ Number of values
Mean = 72 ÷ 20 = 3.6 animals
Data in increasing order:
0, 0, 0, 0, 0, 0, 1, 1, 1, 2, 2, 2, 3, 4, 4, 4, 5, 8, 10, 25
Number of values = 20 (even number)
Median = Average of the two middle values (10th and 11th values)
10th value = 2
11th value = 2
Median = (2 + 2) ÷ 2 = 2 animals
Description of the Data:
The mean (3.6) is higher than the median (2). This suggests the data is skewed by some unusually high values.
Most students have few or no pets 6 students have 0 animals, and most students have between 0-4 animals.
There’s an outlier: One student has 25 animals. This is much higher than everyone else and significantly pulls the mean upward.
The data shows that while most families have few or no pets, a few families (especially the one with 25 animals) might live on farms or have unusual circumstances.
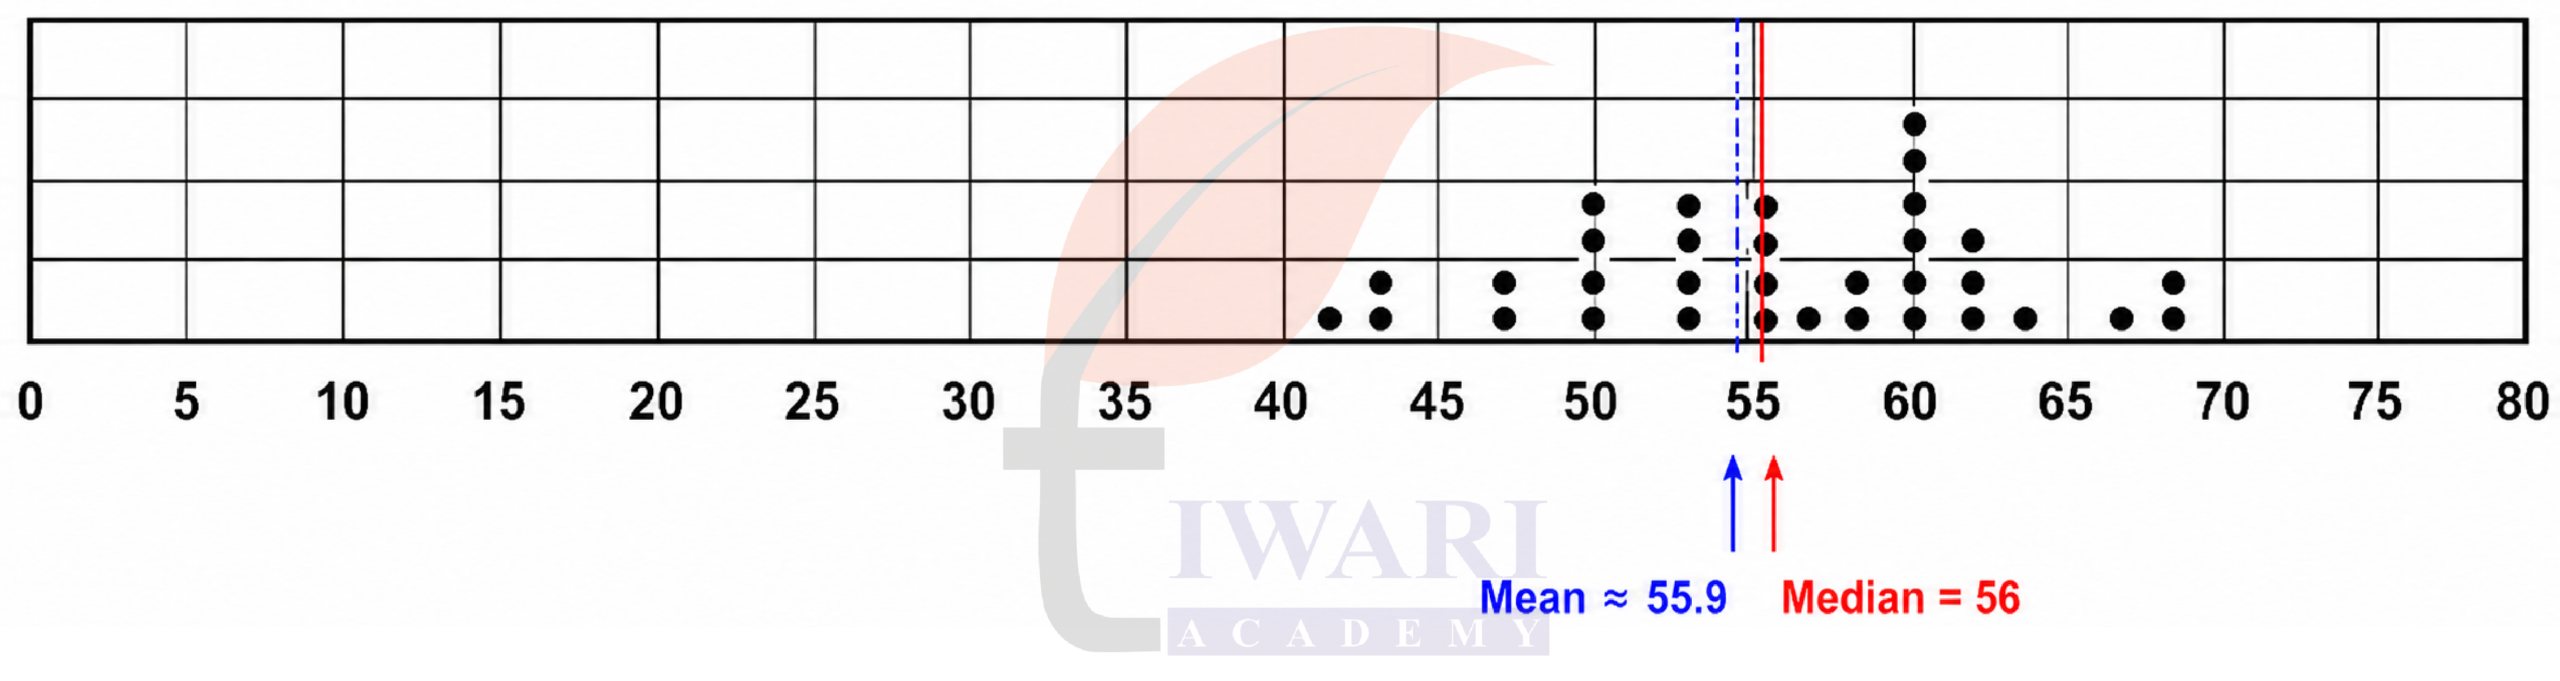
3. Rintu takes care of a date-palm tree farm in Habra. The heights of the trees (in feet) in his farm are given as: 50, 45, 43, 52, 61, 63, 46, 55, 60, 55, 59, 56, 56, 49, 54, 65, 66, 51, 44, 58, 60, 54, 52, 57, 61, 62, 60, 60, 67. Fill the dot plot, and mark the mean and median. How would you describe the heights of these palm trees? Can you think of quicker ways to find the mean? How many trees are shorter than the average height?

Answer:
Given heights (in feet)
50, 45, 43, 52, 61, 63, 46, 55, 60, 55, 59, 56, 56, 49, 54, 65, 66, 51, 44, 58, 60, 54, 52, 57, 61, 62, 60, 60, 67
Total number of trees = 29
Data in ascending order
43, 44, 45, 46, 49, 50, 51, 52, 52, 54, 54, 55, 55, 56, 56, 57, 58, 59, 60, 60, 60, 60, 61, 61, 62, 63, 65, 66, 67
Median
Number of values = 29 (odd)
Median position = (29 + 1) ÷ 2 = 15th value
15th value = 56
Median height = 56 ft
Mean
Sum = 1637
Mean} = 1637/29 = 56.4
Dot plot (how to fill)
Mark numbers from 43 to 67 on the horizontal axis.
Put one dot for each tree above its height.
Heights like 60 will have four dots, 55 and 56 will have two dots, etc.
Description of the data
Most trees are between 50 ft and 62 ft.
Heights are fairly evenly spread around 56.
Mean and median are almost equal, so the data is approximately symmetric.
Quicker way to find the mean
Group nearby numbers (like many values around 55–60).
Take 56 as a central value and see how values balance above and below it.
Since positive and negative differences nearly cancel, the mean is close to 56
Trees shorter than the average height
Average height = 56.4 ft
Trees shorter than this are those up to 56 ft
Count = 15 trees
4. The daily water usage from a tap was measured. The usage in liters for the first few days are: 5.6, 8, 3.09, 12.9, 6.5, 12.1, 11.3, 20.5, 7.4.
(a) Can the mean or median daily usage lie between 25 and 30? Justify your claim using the meaning of mean and median.
(b) Can the mean or median be lesser than the minimum value or greater than the maximum value in a data?
Answer:
Given data (in litres): 5.6, 8, 3.09, 12.9, 6.5, 12.1, 11.3, 20.5, 7.4
Minimum value = 3.09 L
Maximum value = 20.5 L
(a) Data in ascending order: 3.09, 5.6, 6.5, 7.4, 8, 11.3, 12.1, 12.9, 20.5
The middle (5th) value = 8
Median = 8 L
Sum of the data = 5.6 + 8 + 3.09 + 12.9 + 6.5 + 12.1 + 11.3 + 20.5 + 7.4 = 87.39
Mean = 87.39/9 = 9.71 L
Neither the mean nor the median can lie between 25 and 30 litres
(b) Median
The median always lies between the smallest and largest values.
So, the median cannot be less than the minimum or greater than the maximum.
Mean
The mean is the total divided by the number of values.
Since all values lie between 3.09 and 20.5, their average must also lie between them.
Therefore, the mean cannot be less than the minimum or greater than the maximum.
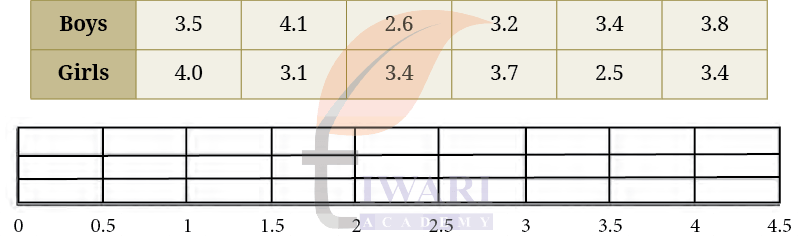
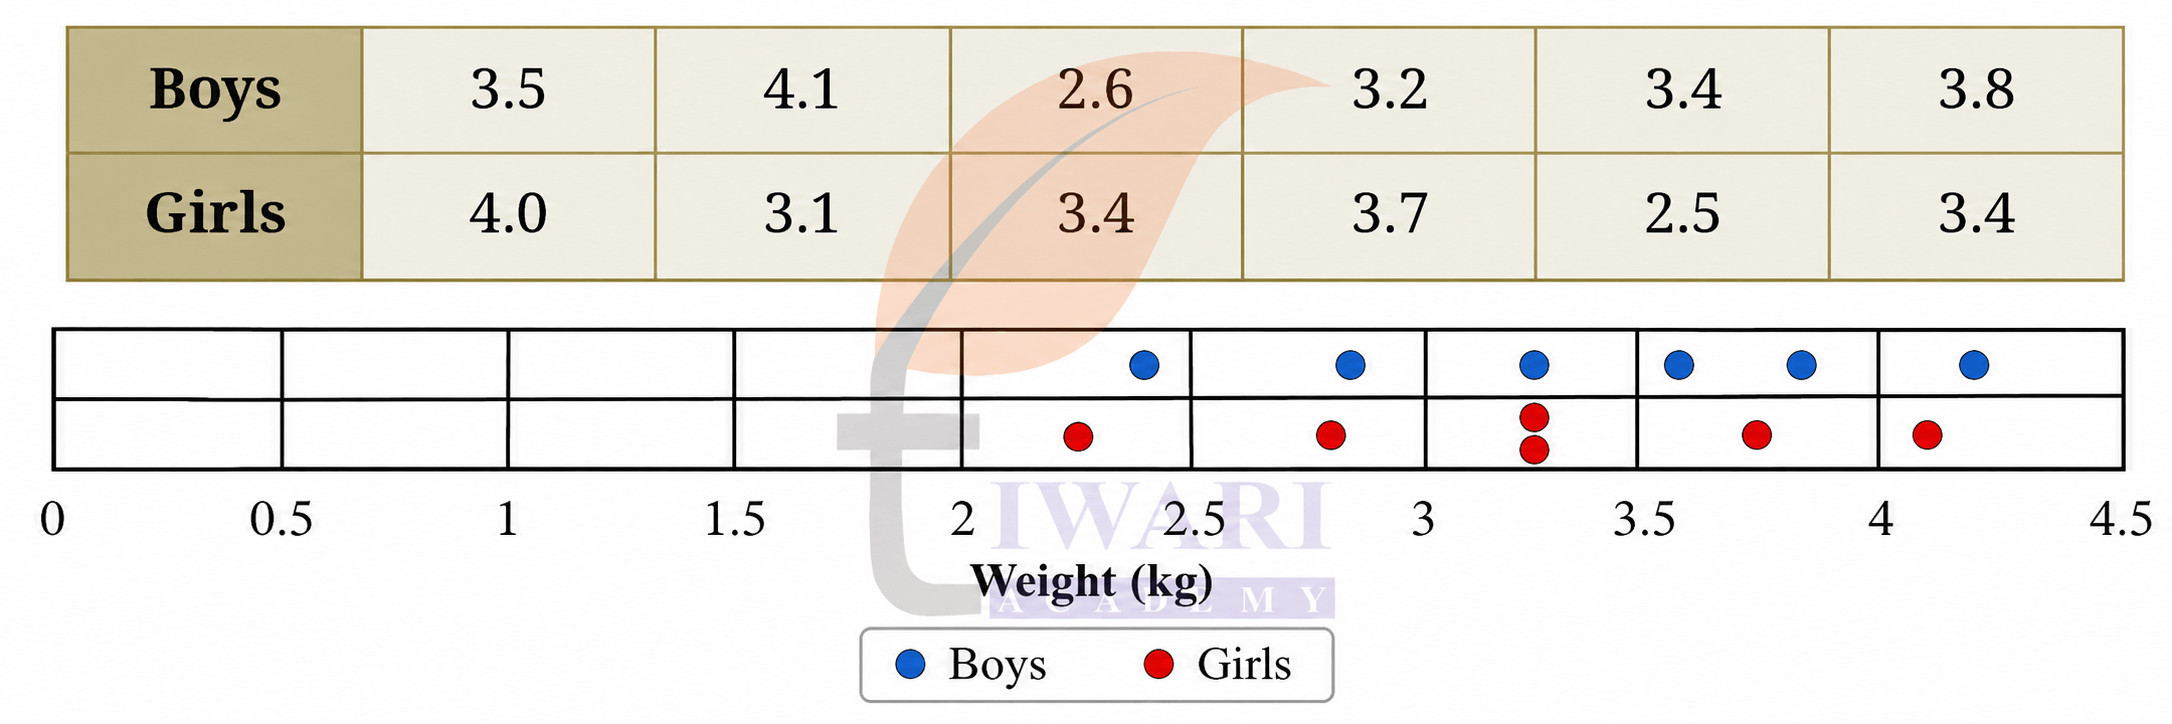
5. The weights of a few newborn babies are given in kgs. Fill the dot plot provided below. Analyse and compare this data.
Answer:
Comparison and analysis
Boys:
Min = 2.6 kg, Max = 4.1 kg
Range = 4.1 − 2.6 = 1.5 kg
Girls:
Min = 2.5 kg, Max = 4.0 kg
Range = 4.0 − 2.5 = 1.5 kg
Both have the same spread.
Boys Median = (3.4 + 3.5) ÷ 2 = 3.45 kg
Girls: Median = (3.4 + 3.4) ÷ 2 = 3.4 kg
Median weights are almost the same.
Boys’ mean ≈ 3.43 kg
Girls’ mean ≈ 3.35 kg
Boys are slightly heavier on average, but the difference is very small.
Conclusion
Most newborns (boys and girls) weigh between 3 kg and 4 kg.
The dot plots for boys and girls overlap a lot.
There is no big difference between the weights of newborn boys and girls.
Both groups show a similar distribution.
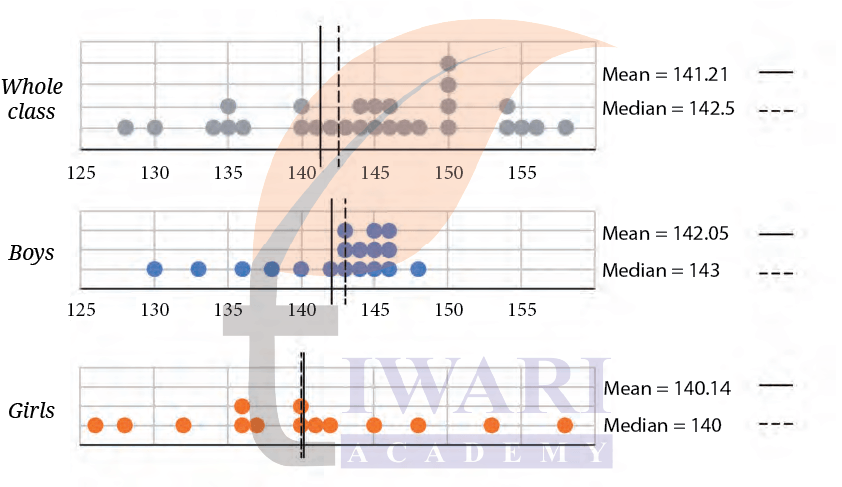
6. The dot plots of heights of another section of Grade 5 students of the same school are shown below. Can you share your observations? What can we infer from the dot plots and the central tendency measures?
Answer:
Whole class
Most students are around 140–145 cm tall
Mean = 141.21 cm
Median = 142.5 cm
Mean and median are close ⇒ average height is reliable
Boys
Most boys are between 140–148 cm
Mean = 142.05 cm
Median = 143 cm
Boys are a little taller than girls
Girls
Most girls are between 135–142 cm
Mean = 140.14 cm
Median = 140 cm
Girls are slightly shorter than boys on average
Comparison
Boys have the highest average height
Girls have the lowest average height
Whole class lies in between
We infer:
Boys are slightly taller than girls.
Heights of boys and girls overlap, so difference is small.
Mean and median are close ⇒ no extreme values.
Most students are around 140-145 cm tall.
Compare the heights of the two sections. Share your observations.
Answer:
Comparison of heights of the two sections (Boys and Girls)
The average height of boys is slightly more than that of girls.
Mean height:
Boys = 142 cm
Girls = 140 cm
Median height:
Boys = 143 cm
Girls = 140 cm
Observations
Most boys are taller than 140 cm, while many girls are around 140 cm.
The height ranges of boys and girls overlap, so the difference is not very large.
Boys have more taller students (above 145 cm) than girls.
Girls’ heights are more concentrated near 140 cm.
7. The weights of some sumo wrestlers and ballet dancers are: Sumo wrestlers: 295.2 kg, 250.7 kg, 234.1 kg, 221.0 kg, 200.9 kg. Ballet dancers: 40.3 kg, 37.6 kg, 38.8 kg, 45.5 kg, 44.1 kg, 48.2 kg. Approximately how many times heavier is a sumo wrestler compared to a ballet dancer?

Answer:
Weights of sumo wrestlers (in kg): 295.2, 250.7, 234.1, 221.0, 200.9
Weights of ballet dancers (in kg): 40.3, 37.6, 38.8, 45.5, 44.1, 48.2
Mean weight of sumo wrestlers:
(295.2 + 250.7 + 234.1 + 221.0 + 200.9)/5
= 1201.9/5 = 240.38 kg
Mean weight of ballet dancers (in kg):
(40.3 + 37.6 + 38.8 + 45.5 + 44.1 + 48.2)/6
= 254.5/6 = 42.42 kg
Compare the mean weights:
240.38/42.42 = 5.66
A sumo wrestler is about 5.7 times heavier than a ballet dancer.
Page 122 – Figure it Out
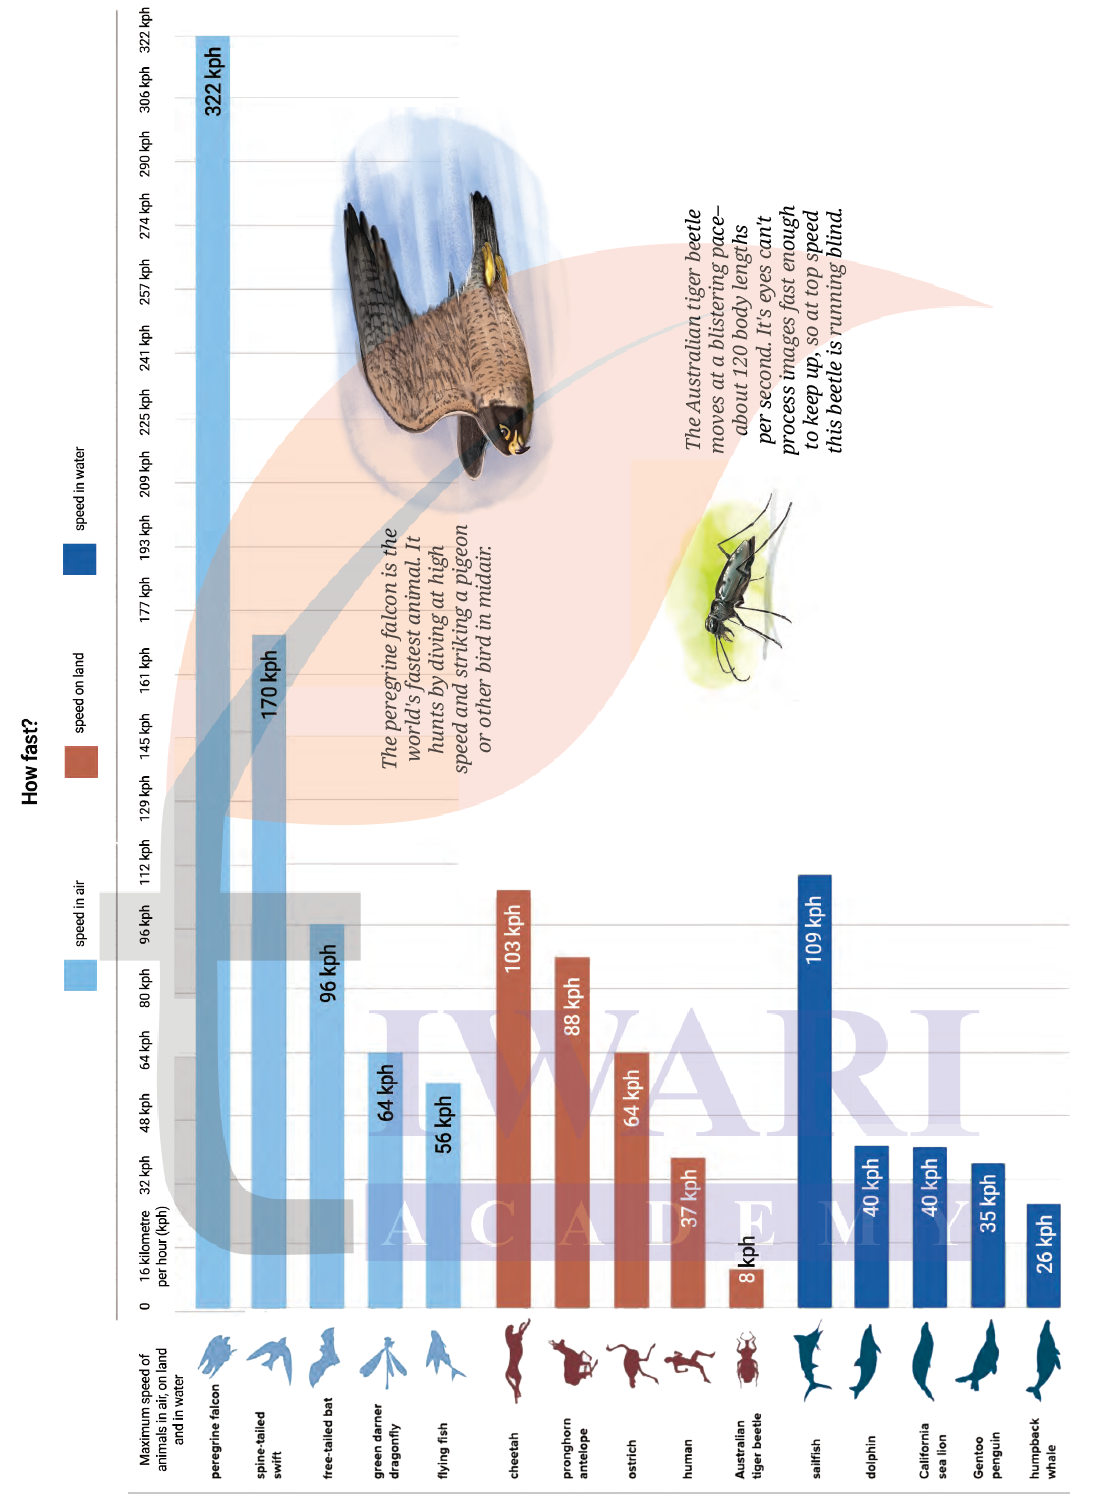
1. The following infographic shows the speeds of a few animals in air, on land, and in water. Can we call this graph a bar graph?
(a) What is the scale used in this graph?
(b) What did you find interesting in this infographic? What do you want to explore further?
(c) Identify a pair of creatures where one’s speed is about twice that of the other.
(d) Can we say that a sailfish is about 4 times faster than a humpback whale? Can we say that a sailfish is the fastest aquatic animal in the world?
Answer:
Yes, this can be called a bar graph. Each animal has a single horizontal bar whose length represents its maximum speed, so it follows the basic rule of a bar graph — bar length is proportional to value. The three colours (light blue for speed in air, brown/orange for speed on land, and dark blue for speed in water) are simply used to group the animals by category, similar to how different colours were used earlier in the chapter to separate Yahapur and Wahapur onion prices. Unlike a clustered/double bar graph, there is only one bar per animal here, not multiple bars for the same animal.
(a) What is the scale used in this graph?
Answer:
The horizontal axis starts at 0 and goes up to 322 (the peregrine falcon’s exact speed), divided into 20 equal parts. So, each unit on the scale represents approximately 16 kph.
(b) What did you find interesting in this infographic? What do you want to explore further?
Answer:
It is interesting that the peregrine falcon (322 kph) is dramatically faster than every other creature in the list – almost twice as fast as the next fastest animal, the spine-tailed swift (170 kph).
It is also interesting that the ostrich, a bird that cannot fly, runs faster (64 kph) than some flying insects like the green darner dragonfly (64 kph) and flying fish (56 kph).
The Australian tiger beetle has the lowest absolute speed (8 kph) in the entire chart, even though it is known as one of the fastest insects relative to its own body length.
One might want to explore further why the fastest land animal, the cheetah, is still slower than the sailfish, the fastest water animal, even though water offers more resistance than air.
(c) Identify a pair of creatures where one’s speed is about twice that of the other.
Answer:
The sailfish (109 kph) and the flying fish (56 kph) form such a pair, since 2 × 56 = 112, which is very close to 109 kph. So, the sailfish is about twice as fast as the flying fish.
(Another valid pair is the spine-tailed swift (170 kph) and the pronghorn antelope (88 kph), since 2 × 88 = 176, which is close to 170 kph.)
(d) Can we say that a sailfish is about 4 times faster than a humpback whale? Can we say that a sailfish is the fastest aquatic animal in the world?
Answer:
Yes, we can say the sailfish is about 4 times faster than the humpback whale, since sailfish = 109 kph, humpback whale = 26 kph, and 4 × 26 = 104, which is close to 109 kph.
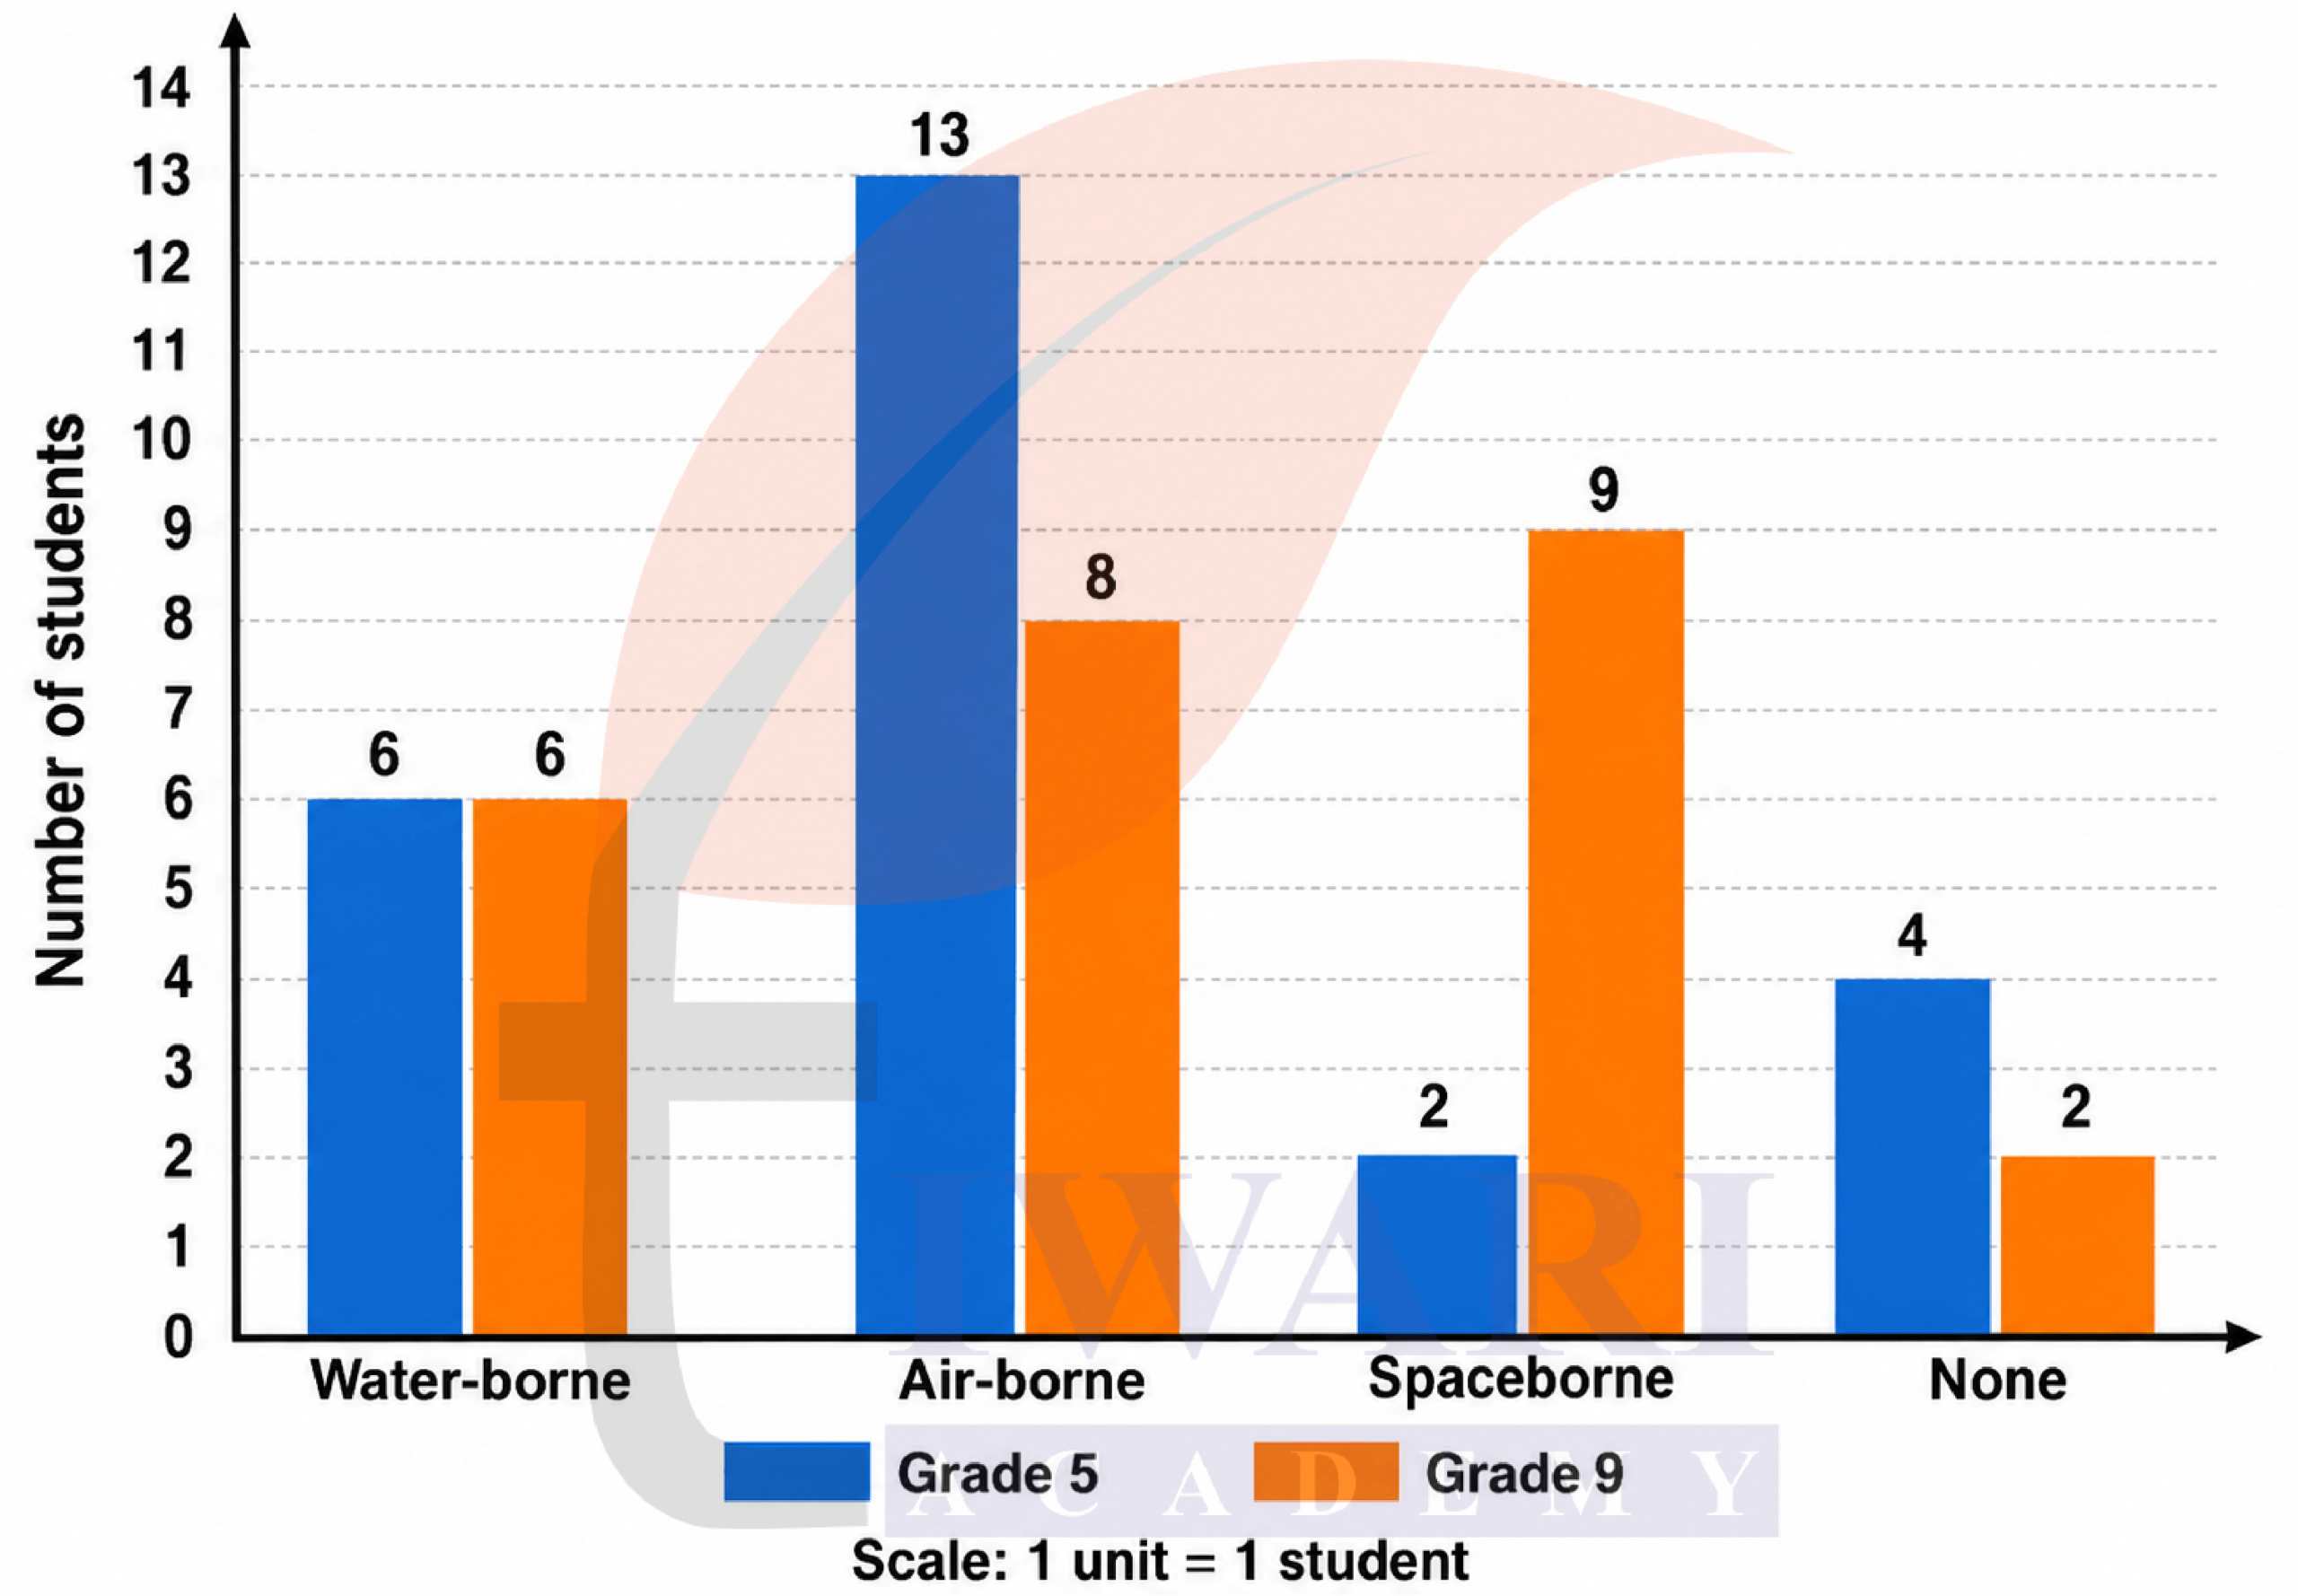
2. Preyashi asked her students ‘If you were to get a super power to become aquatic (water-borne), aerial (air-borne), or spaceborne which one would you choose?’. The responses are shown below. Some chose none. Draw a double-bar graph comparing how both grades chose each option. Choose an appropriate scale.

Answer:
3. The temperature variation over two days in different months in Jodhpur, Rajasthan, is given below. Draw a double-bar graph. Use the scale 1 unit = 4°C. Can you guess which two months these days might belong to?

Answer:
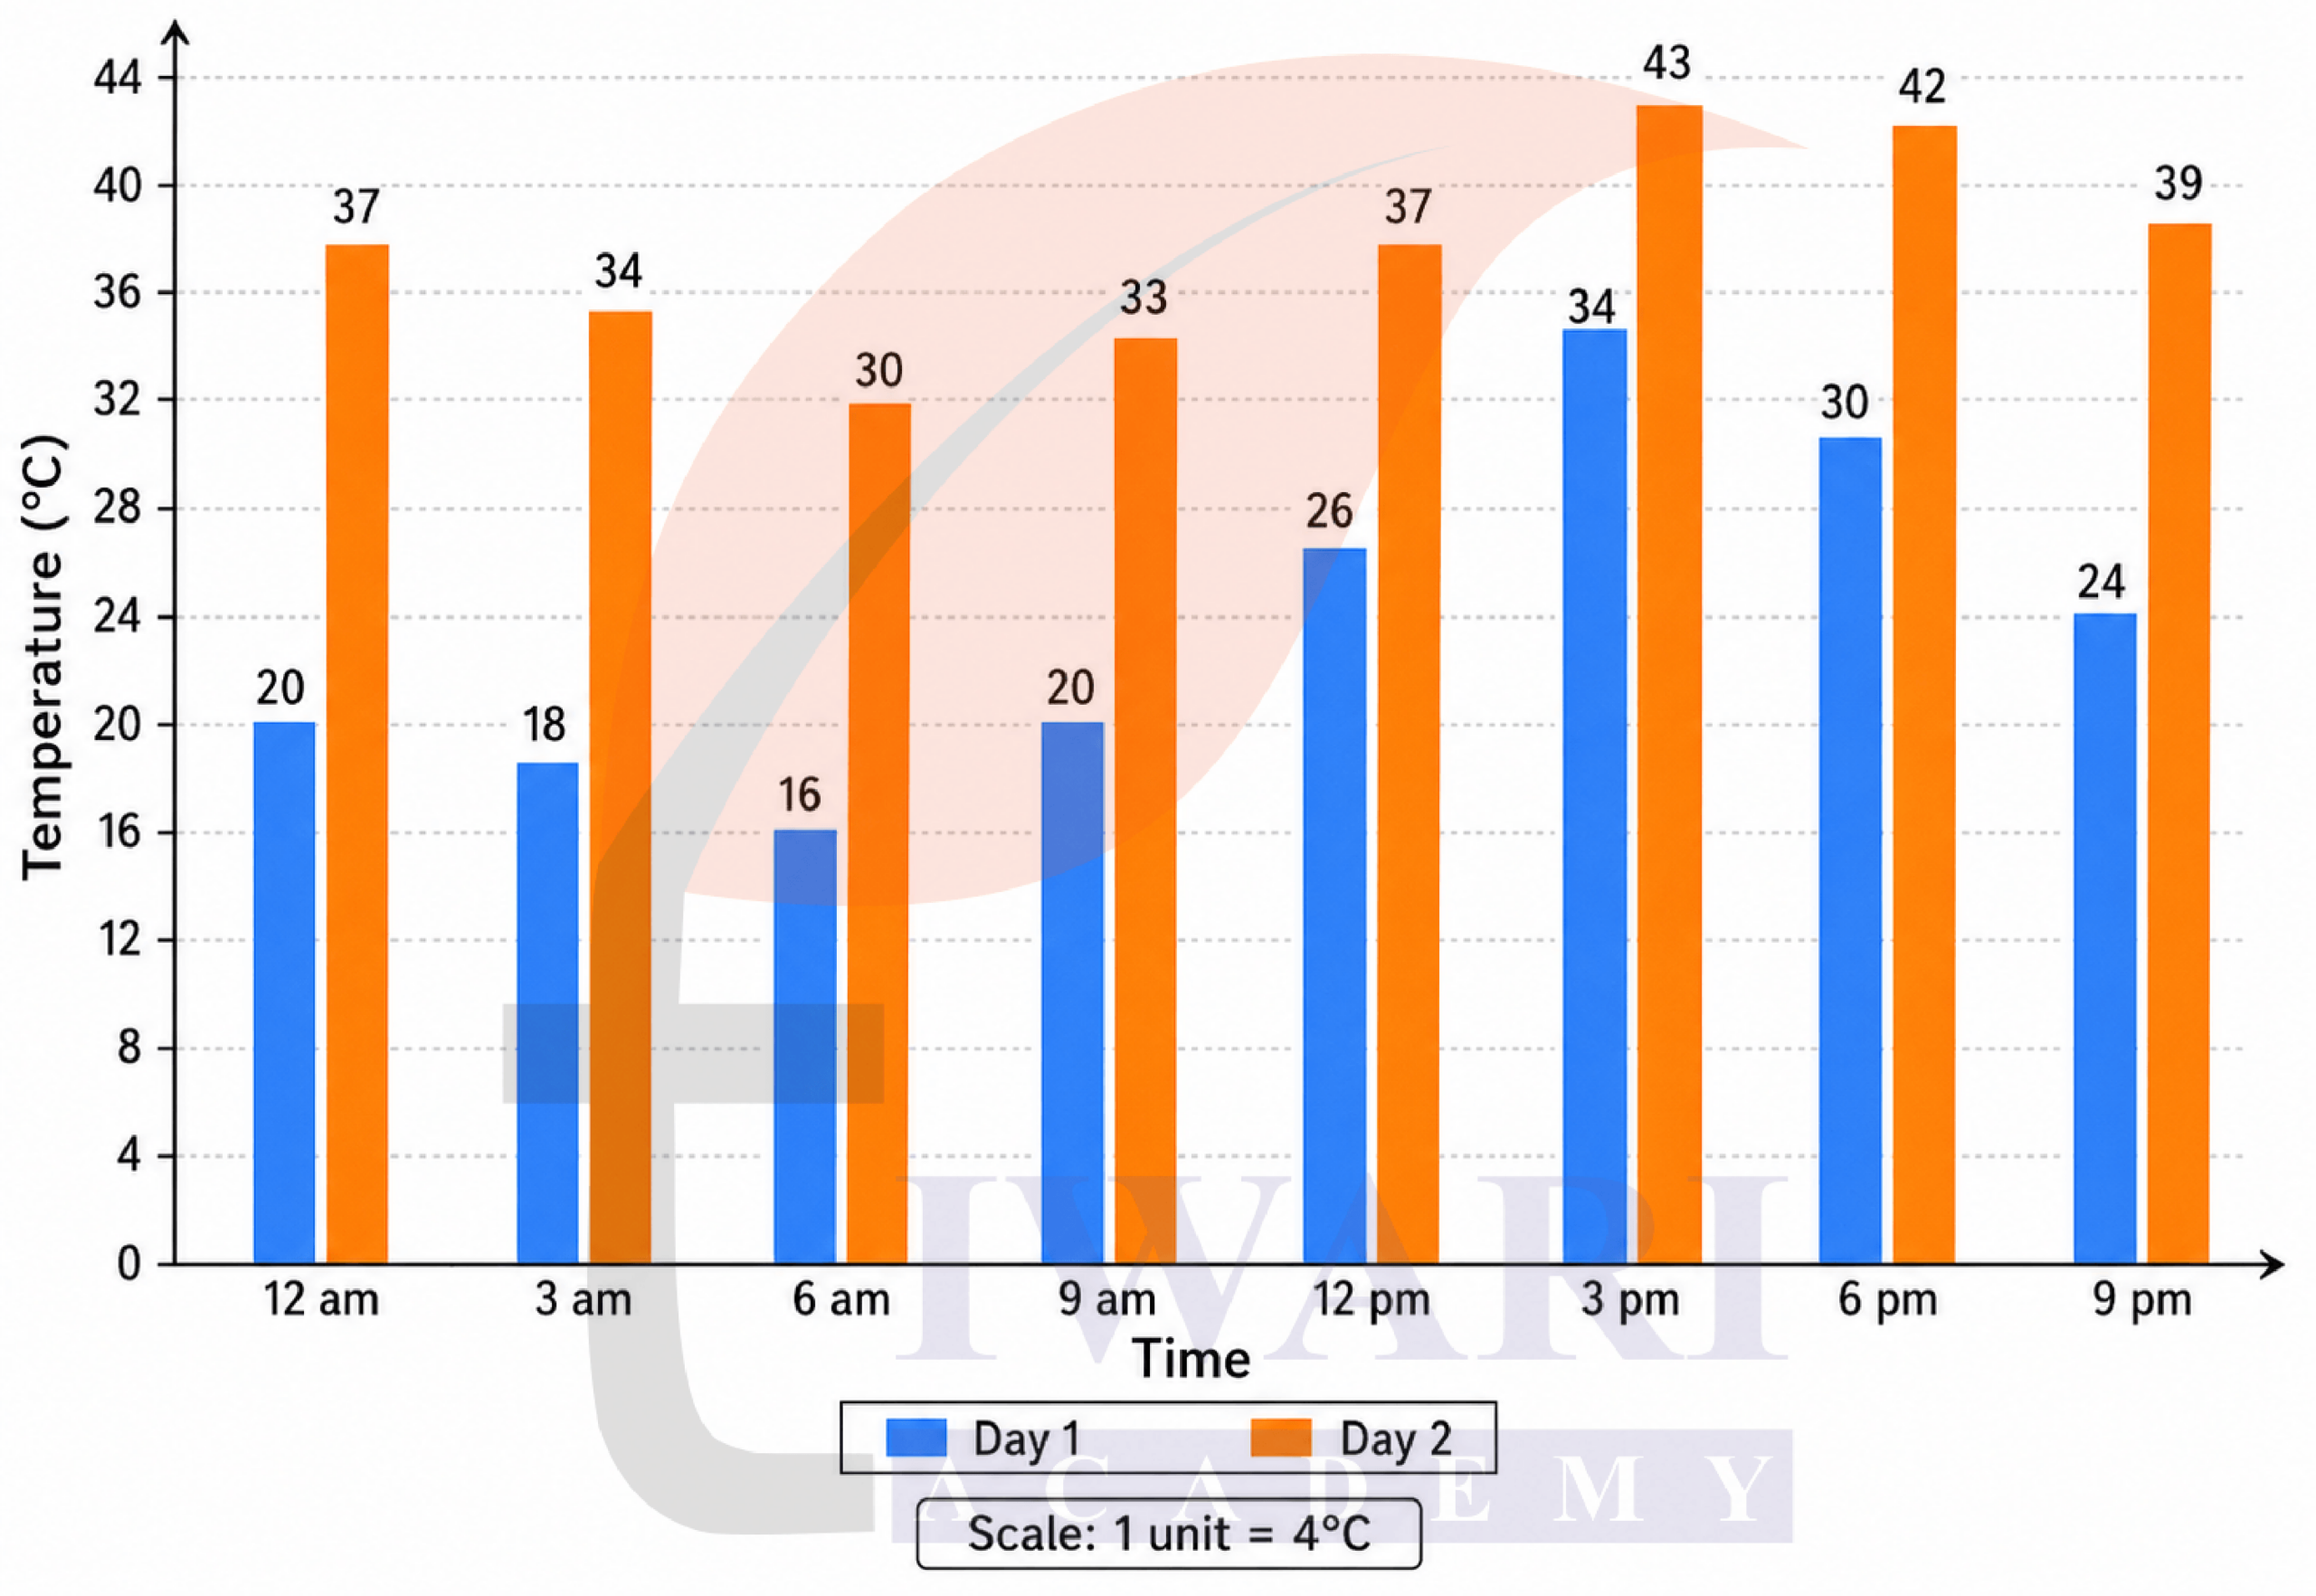
Day 1: Likely January or February (winter)
Temperatures range from 16°C to 34°C
Cool mornings and pleasant afternoons
Day 2: Likely May or June (peak summer)
Temperatures range from 30°C to 43°C
Extremely hot, even at night (37°C at midnight!)
The graph clearly shows the dramatic difference between winter and summer temperatures in Jodhpur, with Day 2 being consistently 13-17°C hotter throughout the entire day.
4. The following clustered-bar graph shows the number of electric vehicles registered in some states every year from 2022 to 2024.
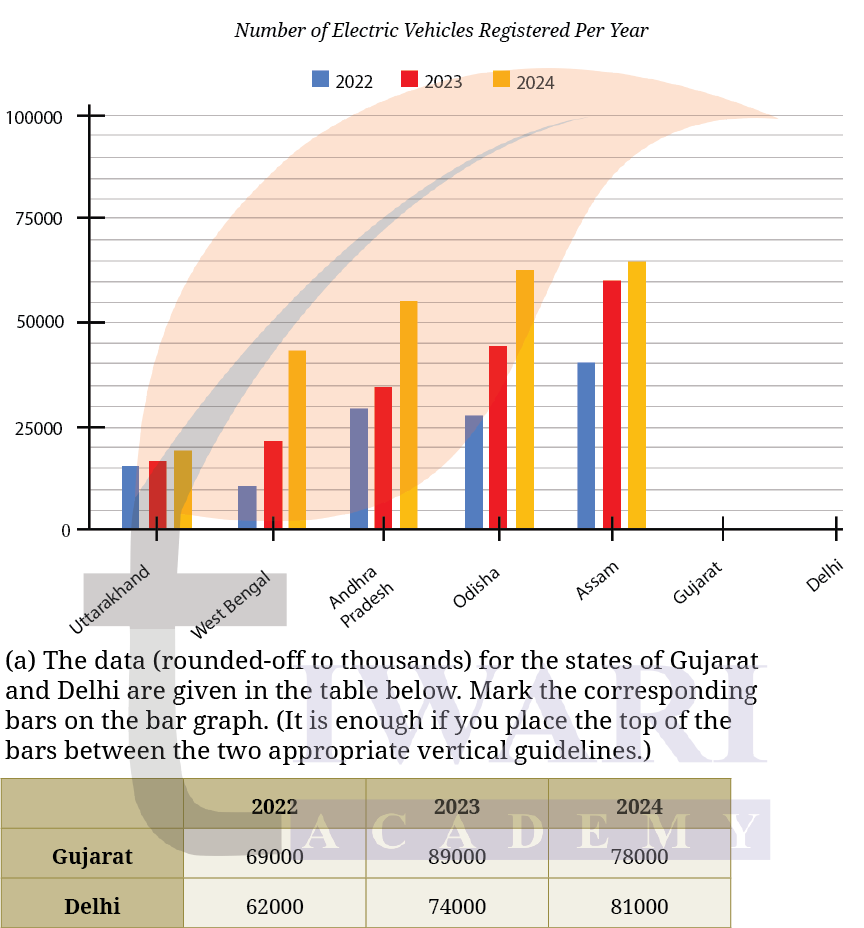
Answer:
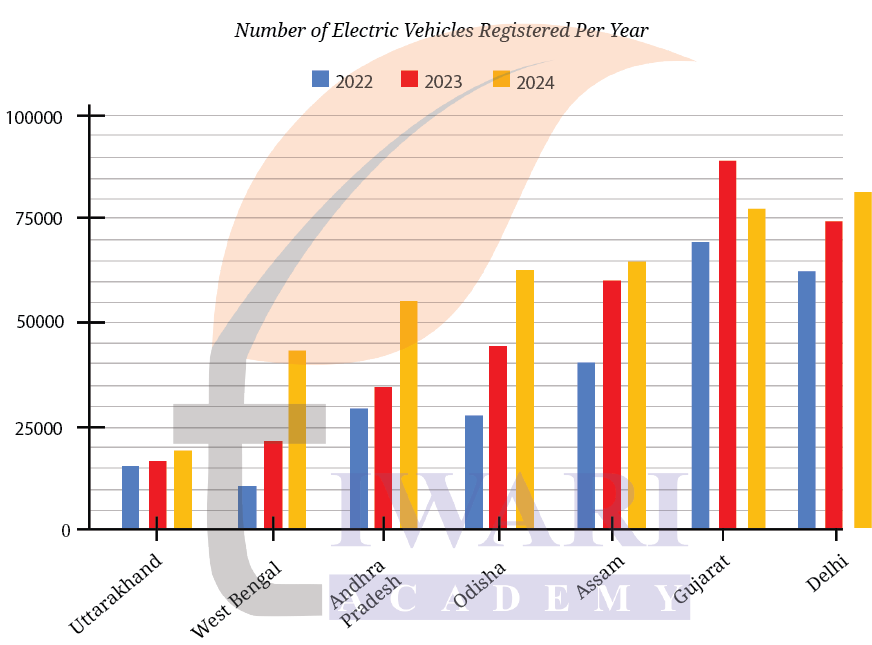
(b) Notice how the graph is organised, what scale is used, and what patterns the data shows.
Answer:
The graph is organised state-wise, with three bars per state representing 2022, 2023 and 2024.
The vertical scale is in thousands of registrations (equal intervals).
Pattern: Most states show an overall increase in EV registrations over the years, with 2024 generally higher than 2022.
(c) How would you describe the change for various states between 2022 and 2024?
Answer:
For all states shown, there is a clear increase in registrations from 2022 to 2024. Some states (like West Bengal, Odisha and Assam) show a large rise, while others (like Uttarakhand) show a smaller but steady increase.
(d) Approximately how many more registrations did Assam get in 2023 compared to 2022?
Answer:
Increase in Assam from 2022 to 2023
Assam in 2022 ≈ 40,000
Assam in 2023 ≈ 60,000
So, Assam got about 20,000 more registrations in 2023 compared to 2022.
(e) How many times more did the registrations in West Bengal increase from 2022 to 2024?
Answer:
2022 ≈ 10,000
2024 ≈ 45,000
Increase factor ≈ 45,000/10,000 = 4.5
So, registrations increased by about 4.5 times.
(f) Is this statement correct — ‘There were very few new registrations in Uttarakhand in 2023 and 2024, as the increase in the bar lengths is minimal’?
Answer:
The statement is not completely correct.
Although the increase in Uttarakhand appears small compared to other states, there is still a noticeable increase from 2022 to 2024. The growth is modest, not very few registrations.
Page 129 – Figure it Out
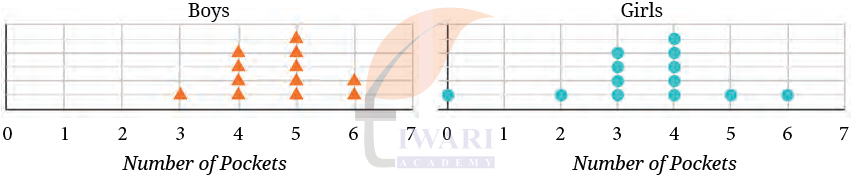
1. The dot plots below show the distribution of the number of pockets on clothing for a group of boys and for a group of girls.
Based on the dot plots, which of the following statements are true?
(a) The data varies more for the boys than for the girls.
(b) The median number of pockets for the boys is more than that for the girls.
(c) The mean number of pockets for the girls is more than that for the boys.
(d) The maximum number of pockets for boys is greater than that for the girls.
Answer:
Boys
Pocket counts are mostly between 3 and 6
Many boys have 4 or 5 pockets
The values are spread out roughly from 3 to 6
Girls
Pocket counts range from 0 to 6
Many girls have 3 or 4 pockets
There are values at 0, 2, 3, 4, 5 and 6
Now check each statement:
(a) False
Boys data ranges from 3 to 6 ⇒ range = 3
Girls data ranges from 0 to 6 ⇒ range = 6
Since girls data covers a wider range, it varies more.
So this statement is not true.
(b) True
Boys dots are concentrated around 4 and 5
Girls dots are concentrated around 3 and 4
So the middle value (median) for boys is higher than that for girls.
This statement is true.
(c) False
Boys generally have more pockets (many at 4 and 5)
Girls have several lower values like 0 and 2
These lower values pull the average (mean) down for girls.
So the girls mean is not more than the boys mean.
(d) False
Both boys and girls have a maximum of 6 pockets.
So this statement is not true.
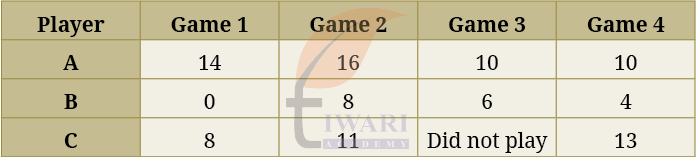
2. The following table shows the points scored by each player in four games:
Now answer the following questions:
(a) Find the average number of points scored per game by A.
(b) To find the mean number of points scored per game by C, would you divide the total points by 3 or by 4? Why? What about B?
(c) Who is the best performer?
Answer:
(a) Player A’s scores:
Game 1 = 14
Game 2 = 16
Game 3 = 10
Game 4 = 10
Total points scored by A: 14 + 16 + 10 + 10 = 50
Number of games played = 4
Average = 50/4 = 12.5
Average points per game by A = 12.5
(b) Player C Scores:
Game 1 = 8
Game 2 = 11
Game 3 = Did not play
Game 4 = 13
Player C played only 3 games, not 4.
Total points by C (8 + 11 + 13 = 32)
So, we divide by 3, not 4.
Mean for C = 32/3 approx 10.67
Reason:
We divide by the number of games actually played, not the total number of games.
Player B Scores:
Game 1 = 0
Game 2 = 8
Game 3 = 6
Game 4 = 4
Player B played all 4 games, even though one score is 0.
Total points by B: 0 + 8 + 6 + 4 = 18
Mean for B = 18/4} = 4.5
Reason:
Scoring 0 still counts as playing the game, so we divide by 4.
(c) Compare average points per game:
A: 12.5
C: ≈ 10.67
B: 4.5
Player A is the best performer, as A has the highest average score per game.
3. The marks (out of 100) obtained by a group of students in a General Knowledge quiz are 85, 76, 90, 85, 39, 48, 56, 95, 81 and 75. Another group’s scores in the same quiz are 68, 59, 73, 86, 47, 79, 90, 93 and 86. Compare and describe both the groups performance using, mean and median.
Answer:
Group 1
Marks: 85, 76, 90, 85, 39, 48, 56, 95, 81, 75
Total marks = 85 + 76 + 90 + 85 + 39 + 48 + 56 + 95 + 81 + 75 = 730
Number of students = 10
Mean = 730/10 = 73
Arrange in ascending order:
39, 48, 56, 75, 76, 81, 85, 85, 90, 95
Median = average of 5th and 6th terms
Median = (76 + 81)/2 = 78.5
Group 2
Marks: 68, 59, 73, 86, 47, 79, 90, 93, 86
Total marks = 68 + 59 + 73 + 86 + 47 + 79 + 90 + 93 + 86 = 681
Number of students = 9
Mean = 681/9 = approx 75.7
Arrange in ascending order:
47, 59, 68, 73, 79, 86, 86, 90, 93
Median = 5th term
Median = 79
Comparison and Conclusion
Group 2 has a higher mean (75.7) than Group 1 (73).
Group 2 also has a slightly higher median (79) than Group 1 (78.5).
Group 1 has some very low marks, which reduce its mean.
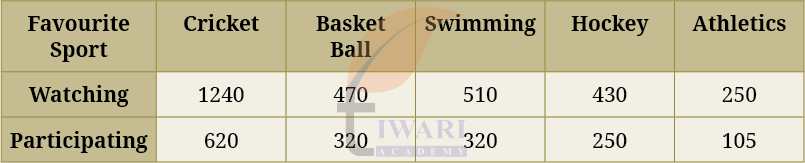
4. Consider this data collected from a survey of a colony. Choose an appropriate scale and draw a double-bar graph. Write down your observations.
Answer:
Observations from the graph
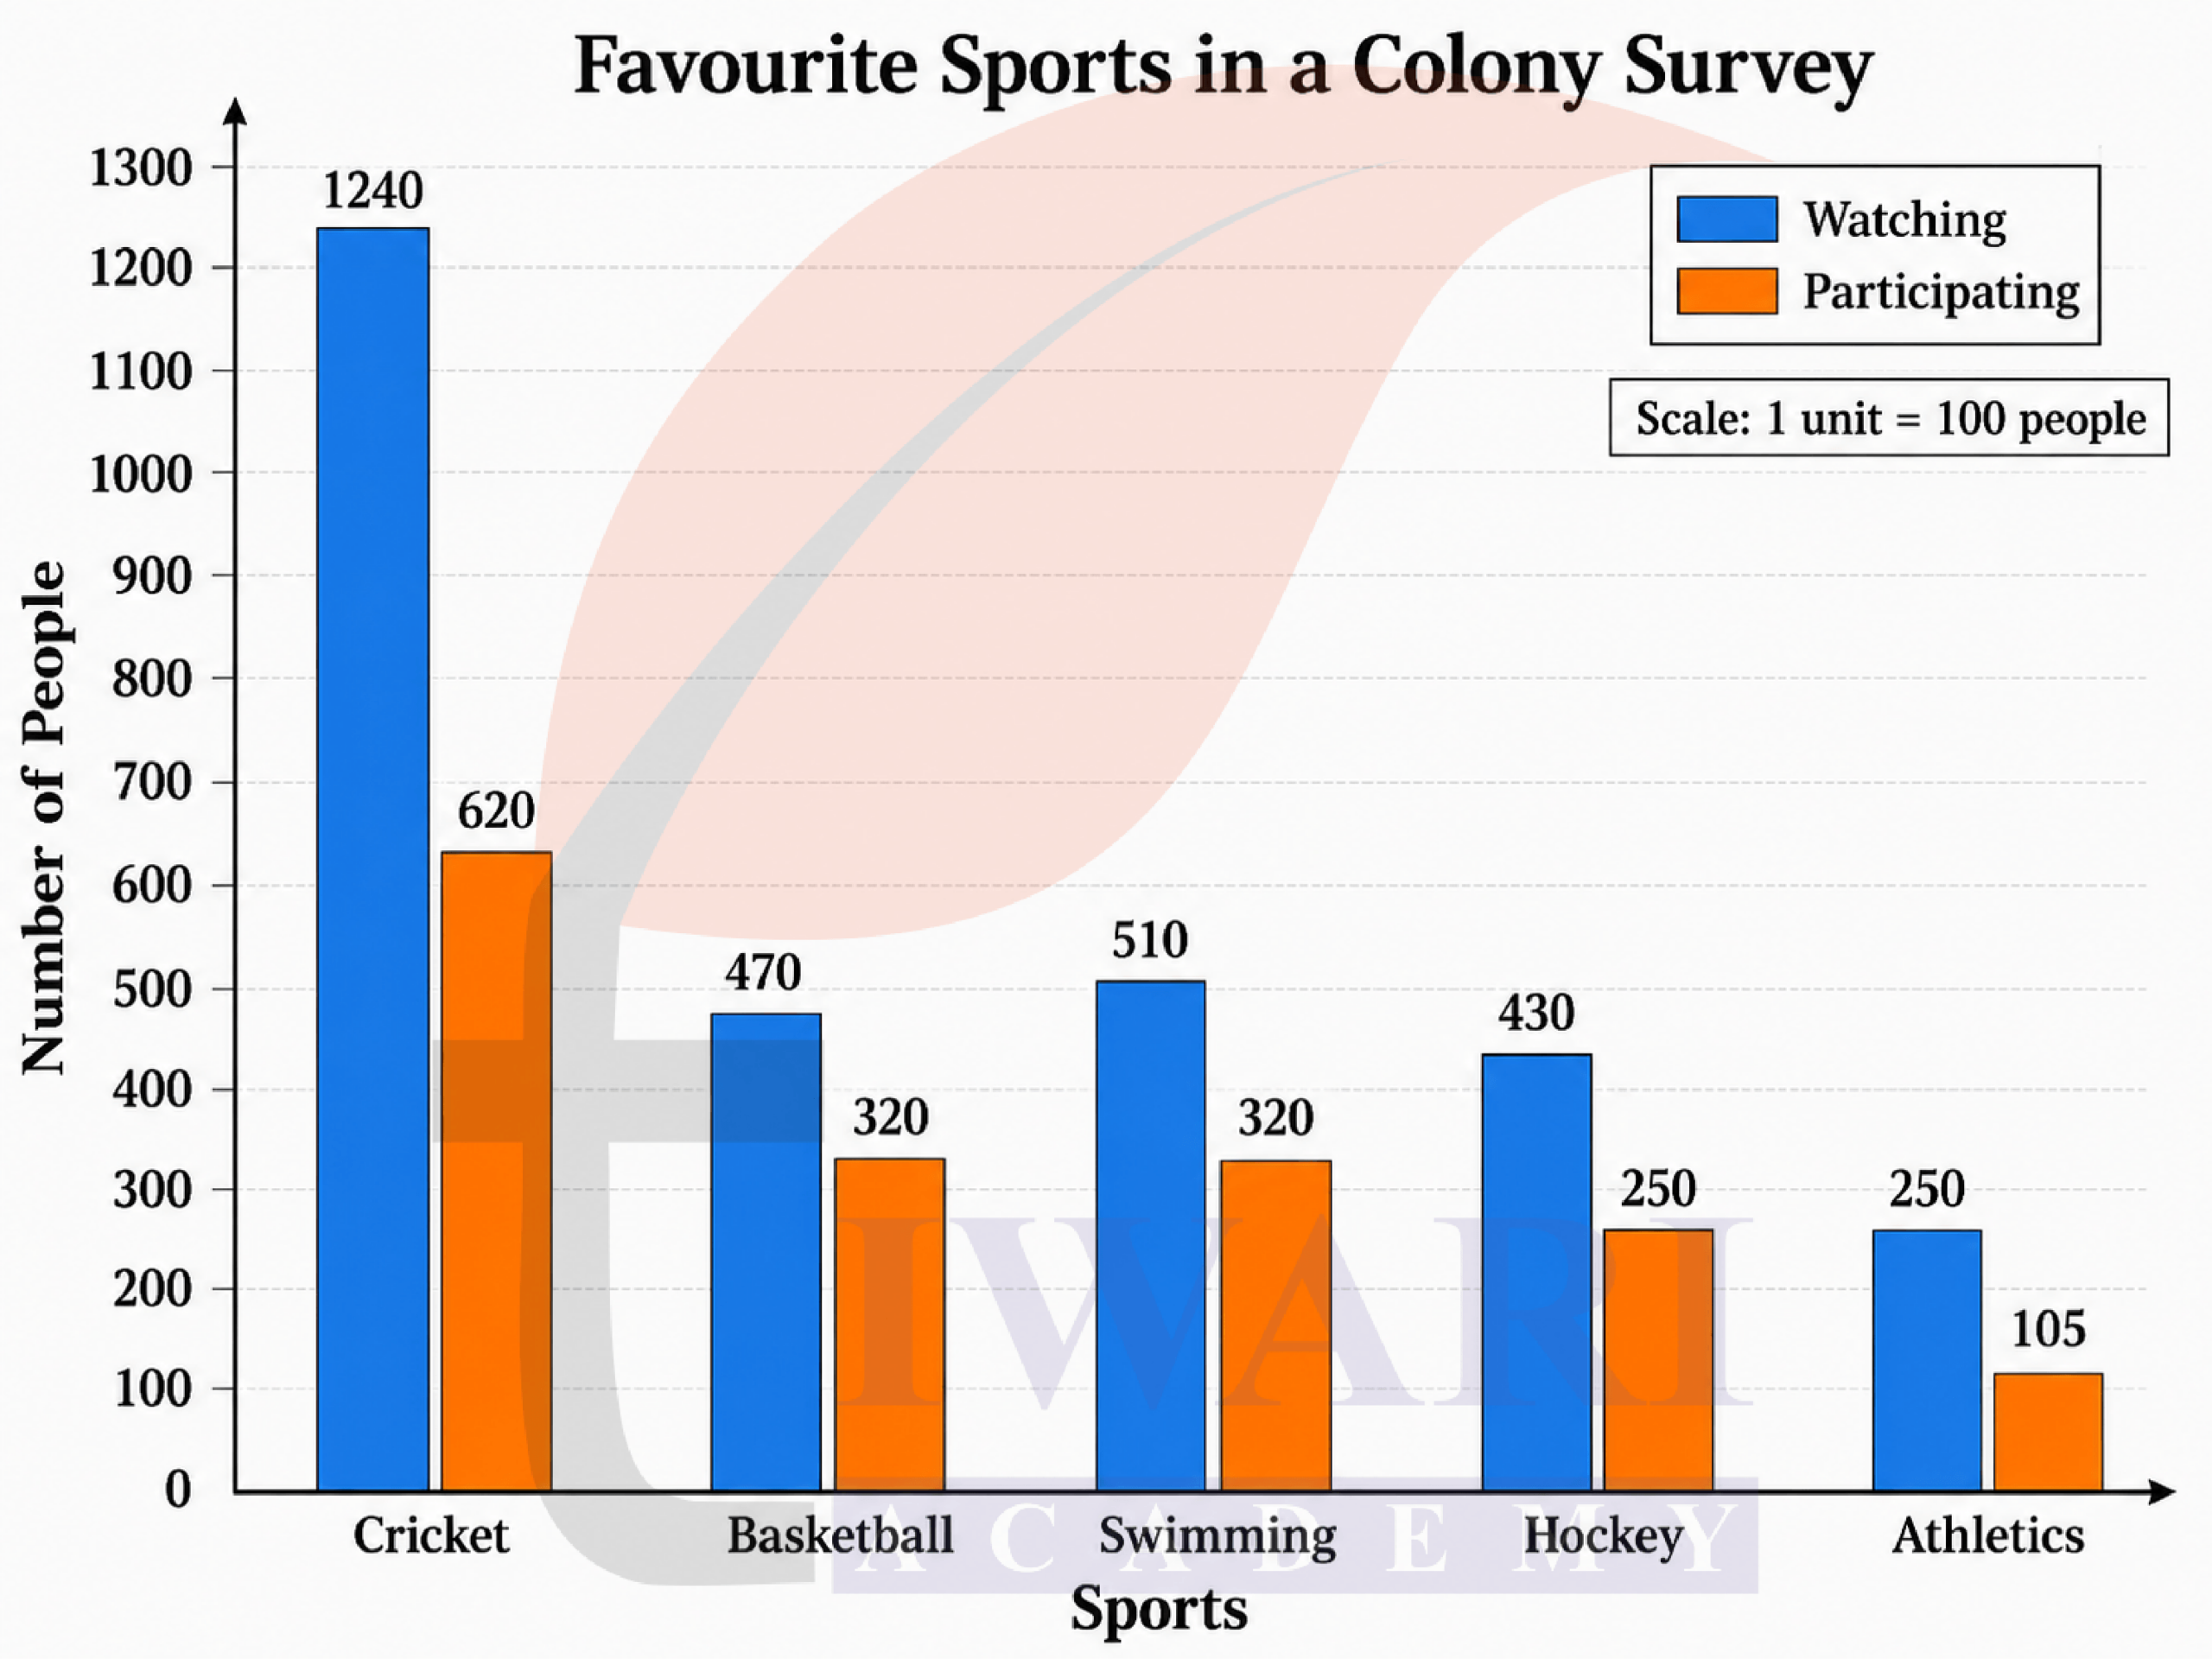
- Cricket is the most popular sport for both watching and participating.
- For every sport, the number of people watching is more than those participating.
- The difference between watching and participating is largest for cricket.
- Athletics has the least number of people both watching and participating.
- Basketball and swimming have the same number of participants (320), but swimming is watched by more people.
- Overall, people prefer watching sports more than playing them.
5. Consider a group of 17 students with the following heights (in cm): 106, 110, 123, 125, 117, 120, 112, 115, 110, 120, 115, 102, 115, 115, 109, 115, 101. The sports teacher wants to divide the class into two groups so that each group has an equal number of students: one group has students with height less than a particular height and the other group has students with heights greater than the particular height. Suggest a way to do this. Can you guess the age of these students based on the tabular data in the ‘Telling Tall Tales’ section?
Answer:
Arrange the heights in ascending order
101, 102, 106, 109, 110, 110, 112, 115, 115, 115, 115, 115, 117, 120, 120, 123, 125
Total students = 17
For 17 observations, the median is the 9th value.
Median height = 115 cm
Students with height less than 115 cm ⇒ 8 students
Students with height greater than 115 cm ⇒ 8 students
The student(s) with height exactly 115 cm lie at the dividing point.
So, the teacher can use 115 cm as the particular height to divide the class fairly.
From the height data given children with heights around 100-125 cm are usually about 7-8 years old.
6. Describe the mean and median of heights of your class. You can visualise the heights on a dot plot.
Answer:
The heights, in centimetres, are:
142, 145, 145, 147, 148, 150, 150, 150, 152, 153, 154, 155, 155, 158, 160
Mean = Sum of all heights ÷ Number of students
= 2264 ÷ 15
= 150.93 cm
So, the mean height of my class is about 150.9 cm.
The heights are already arranged from smallest to largest.
There are 15 students, so the median is the middle, or 8th, value.
The 8th value is 150 cm.
Therefore, the median height = 150 cm.
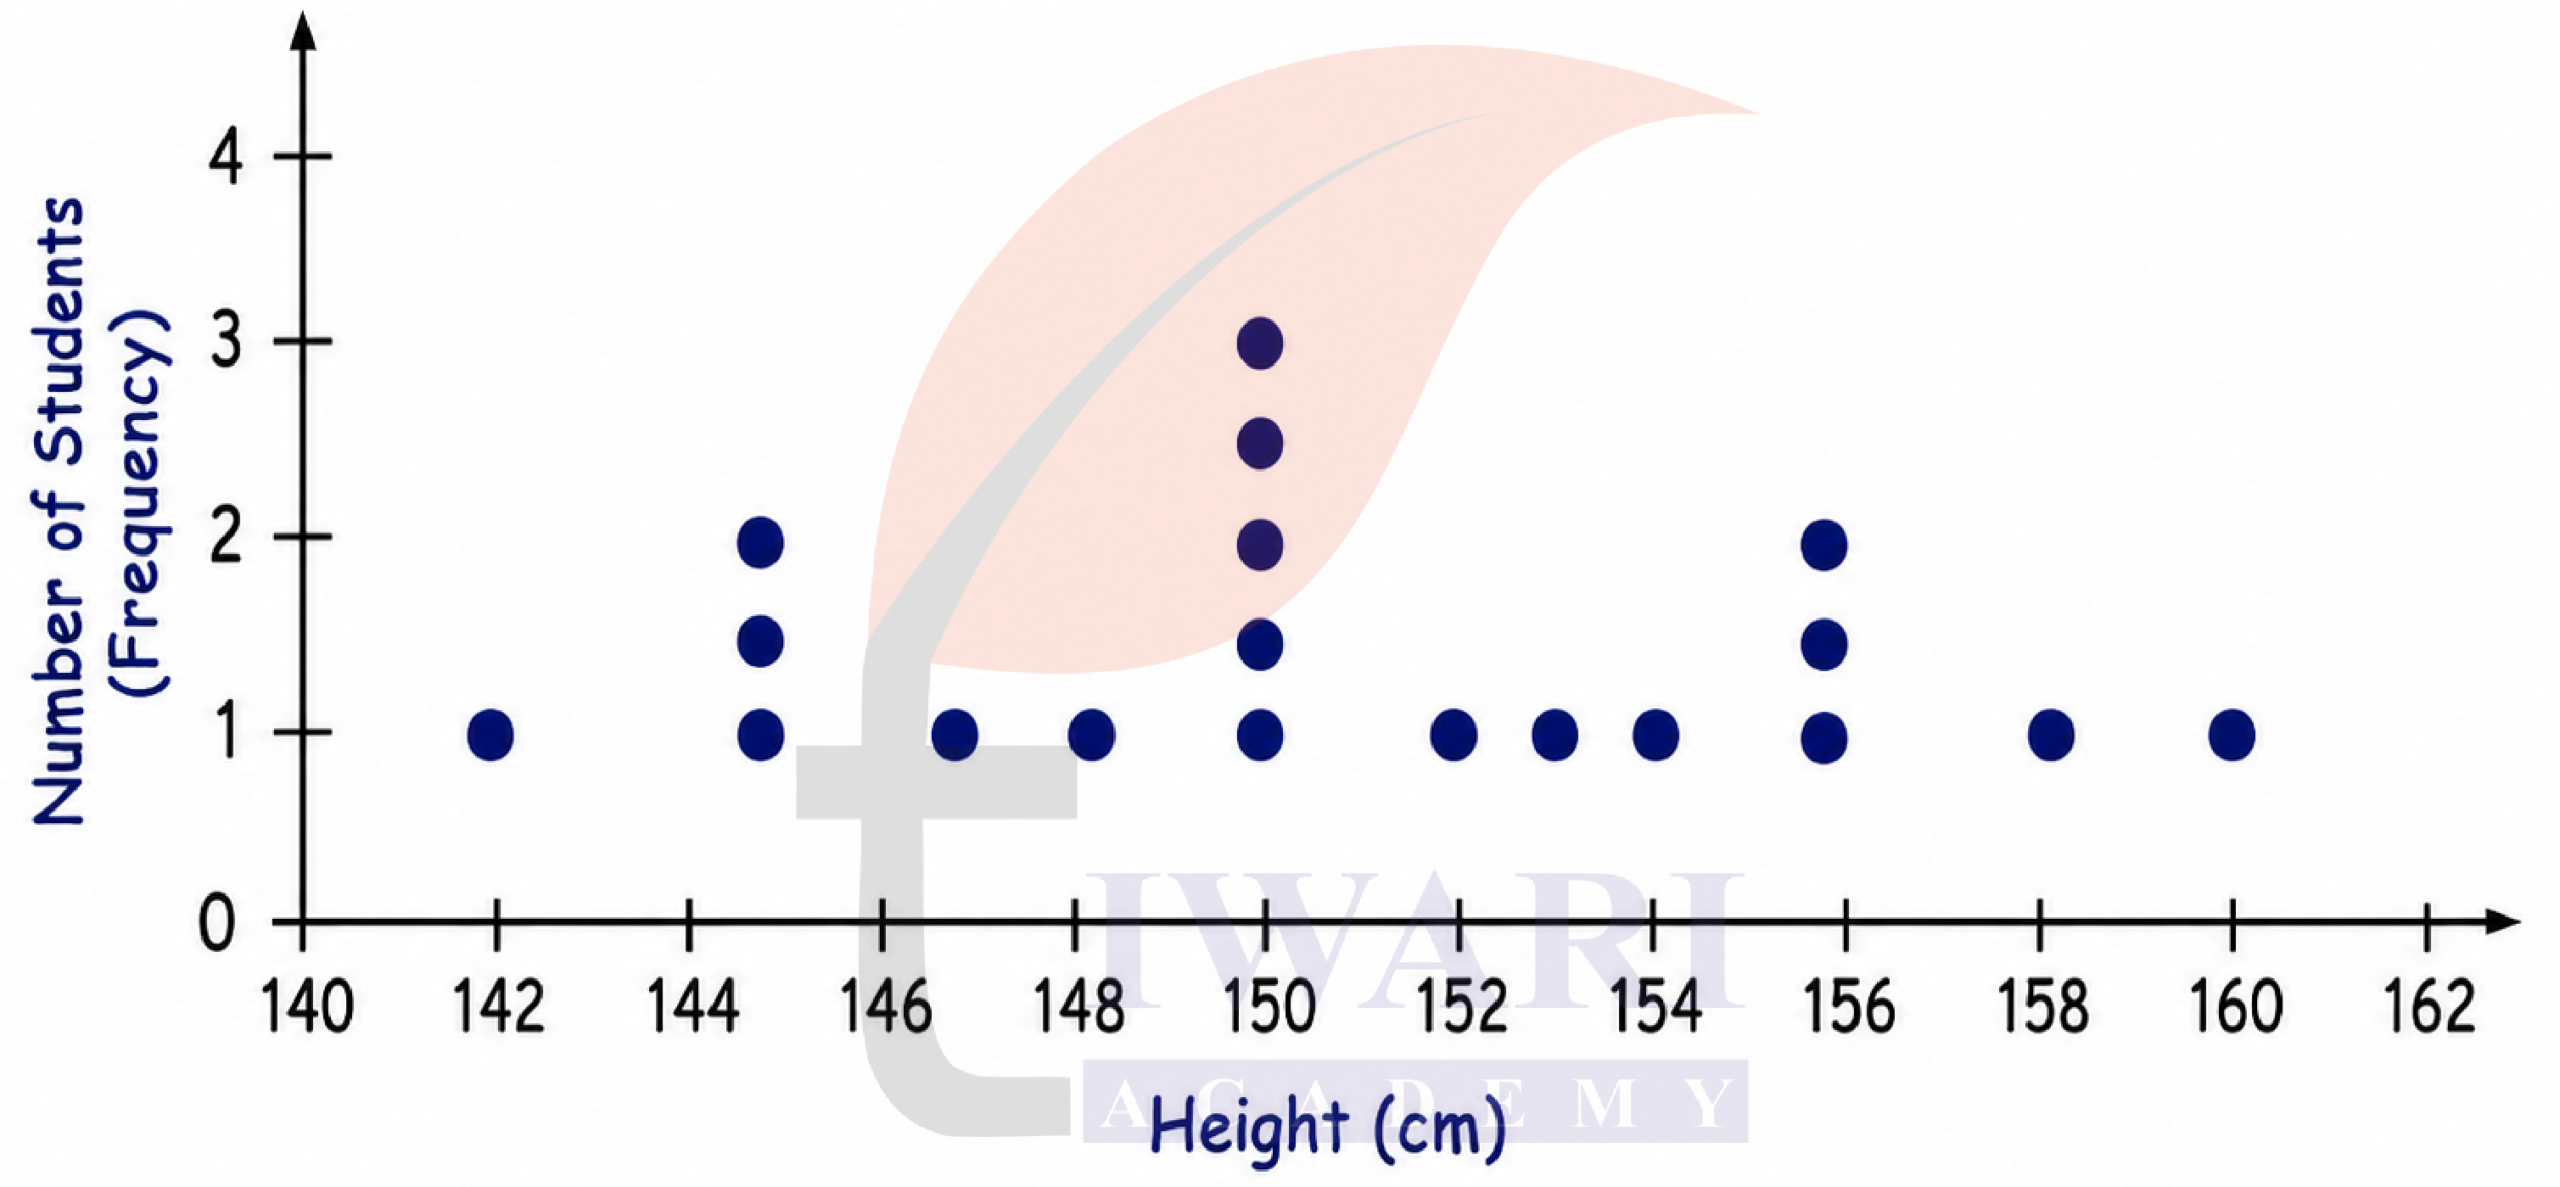
The heights of the students range from 142 cm to 160 cm. Most of the heights are clustered around 150–155 cm. The mean height is about 150.9 cm, while the median height is 150 cm. Since the mean and median are quite close, the heights are fairly balanced and there is no very large outlier affecting the data.
7. There are two 7th grade sections at a school. Each section has 15 boys and 15 girls. In one section, the mean height of students is 154.2 cm. From this information, what must be true about the mean height of students in the other section?
(a) The mean height of students in the other section is 154.2 cm.
(b) The mean height of students in the other section is less than 154.2 cm.
(c) The mean height of students in the other section is more than 154.2 cm.
(d) The mean height of students in the other section cannot be determined.
Answer:
(d) The mean height of students in the other section cannot be determined.
Explanation:
We are given that both sections have the same number of students -15 boys and 15 girls, making 30 students in each section. We are also told that the mean height of one section is 154.2 cm.
However, no information is provided about the individual heights or the average height of students in the other section. Therefore, we cannot calculate or infer its mean height.
8. Standing tall in the storm.
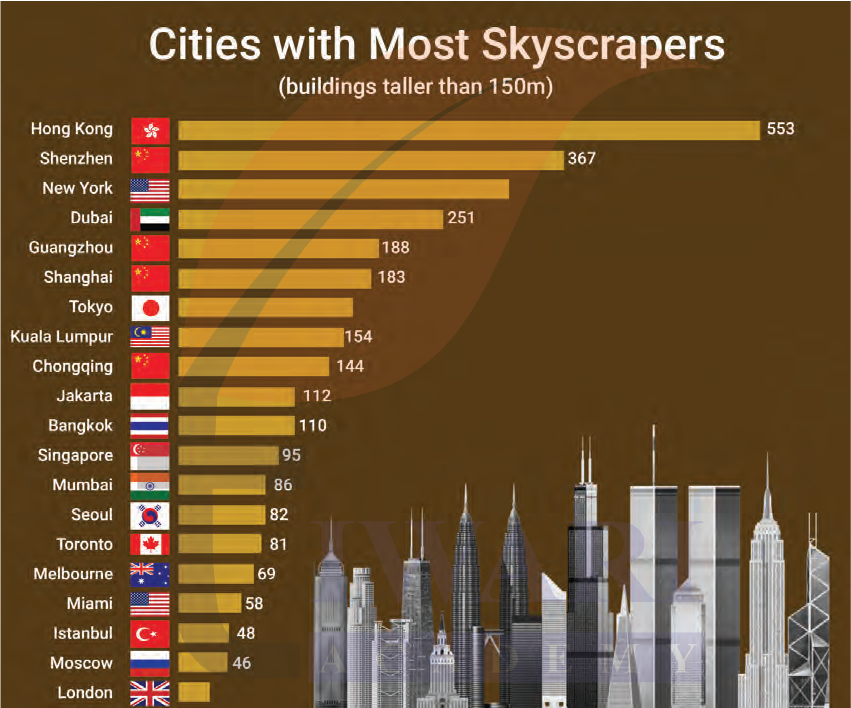
(a) Write estimated values for the number of skyscrapers in New York, Tokyo, and London.
(b) Are the following statements valid?
(i) Only 12 cities have more skyscrapers than Mumbai.
(ii) Only 7 cities have fewer skyscrapers than Mumbai.
(iii) The tallest building in the world is in Hong Kong.
Answer:
(a) From the bars in the graph:
New York = 300 skyscrapers
Tokyo = 160 skyscrapers
London = 40 skyscrapers
(These are estimates based on the lengths of the bars.)
(b)
(i) Valid
Cities with more skyscrapers than Mumbai (86) are:
Hong Kong, Shenzhen, New York, Dubai, Guangzhou, Shanghai, Tokyo, Kuala Lumpur, Chongqing, Jakarta, Bangkok, Singapore
⇒ 12 cities
(ii) Valid
Cities with fewer skyscrapers than Mumbai are:
Seoul, Toronto, Melbourne, Miami, Istanbul, Moscow, London
⇒ 7 cities
(iii) Not valid
The graph shows the number of skyscrapers, not the height of the tallest building. Therefore, this statement cannot be concluded from the given data.
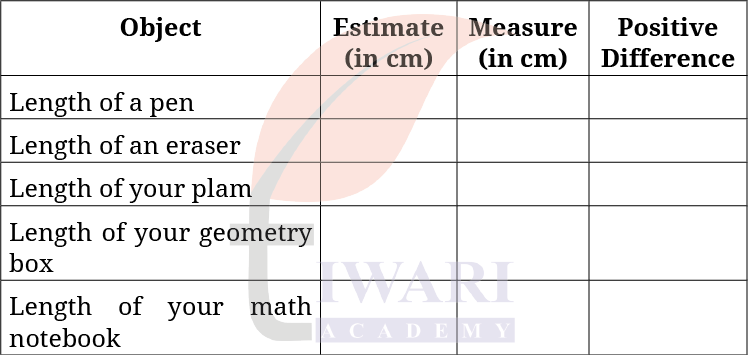
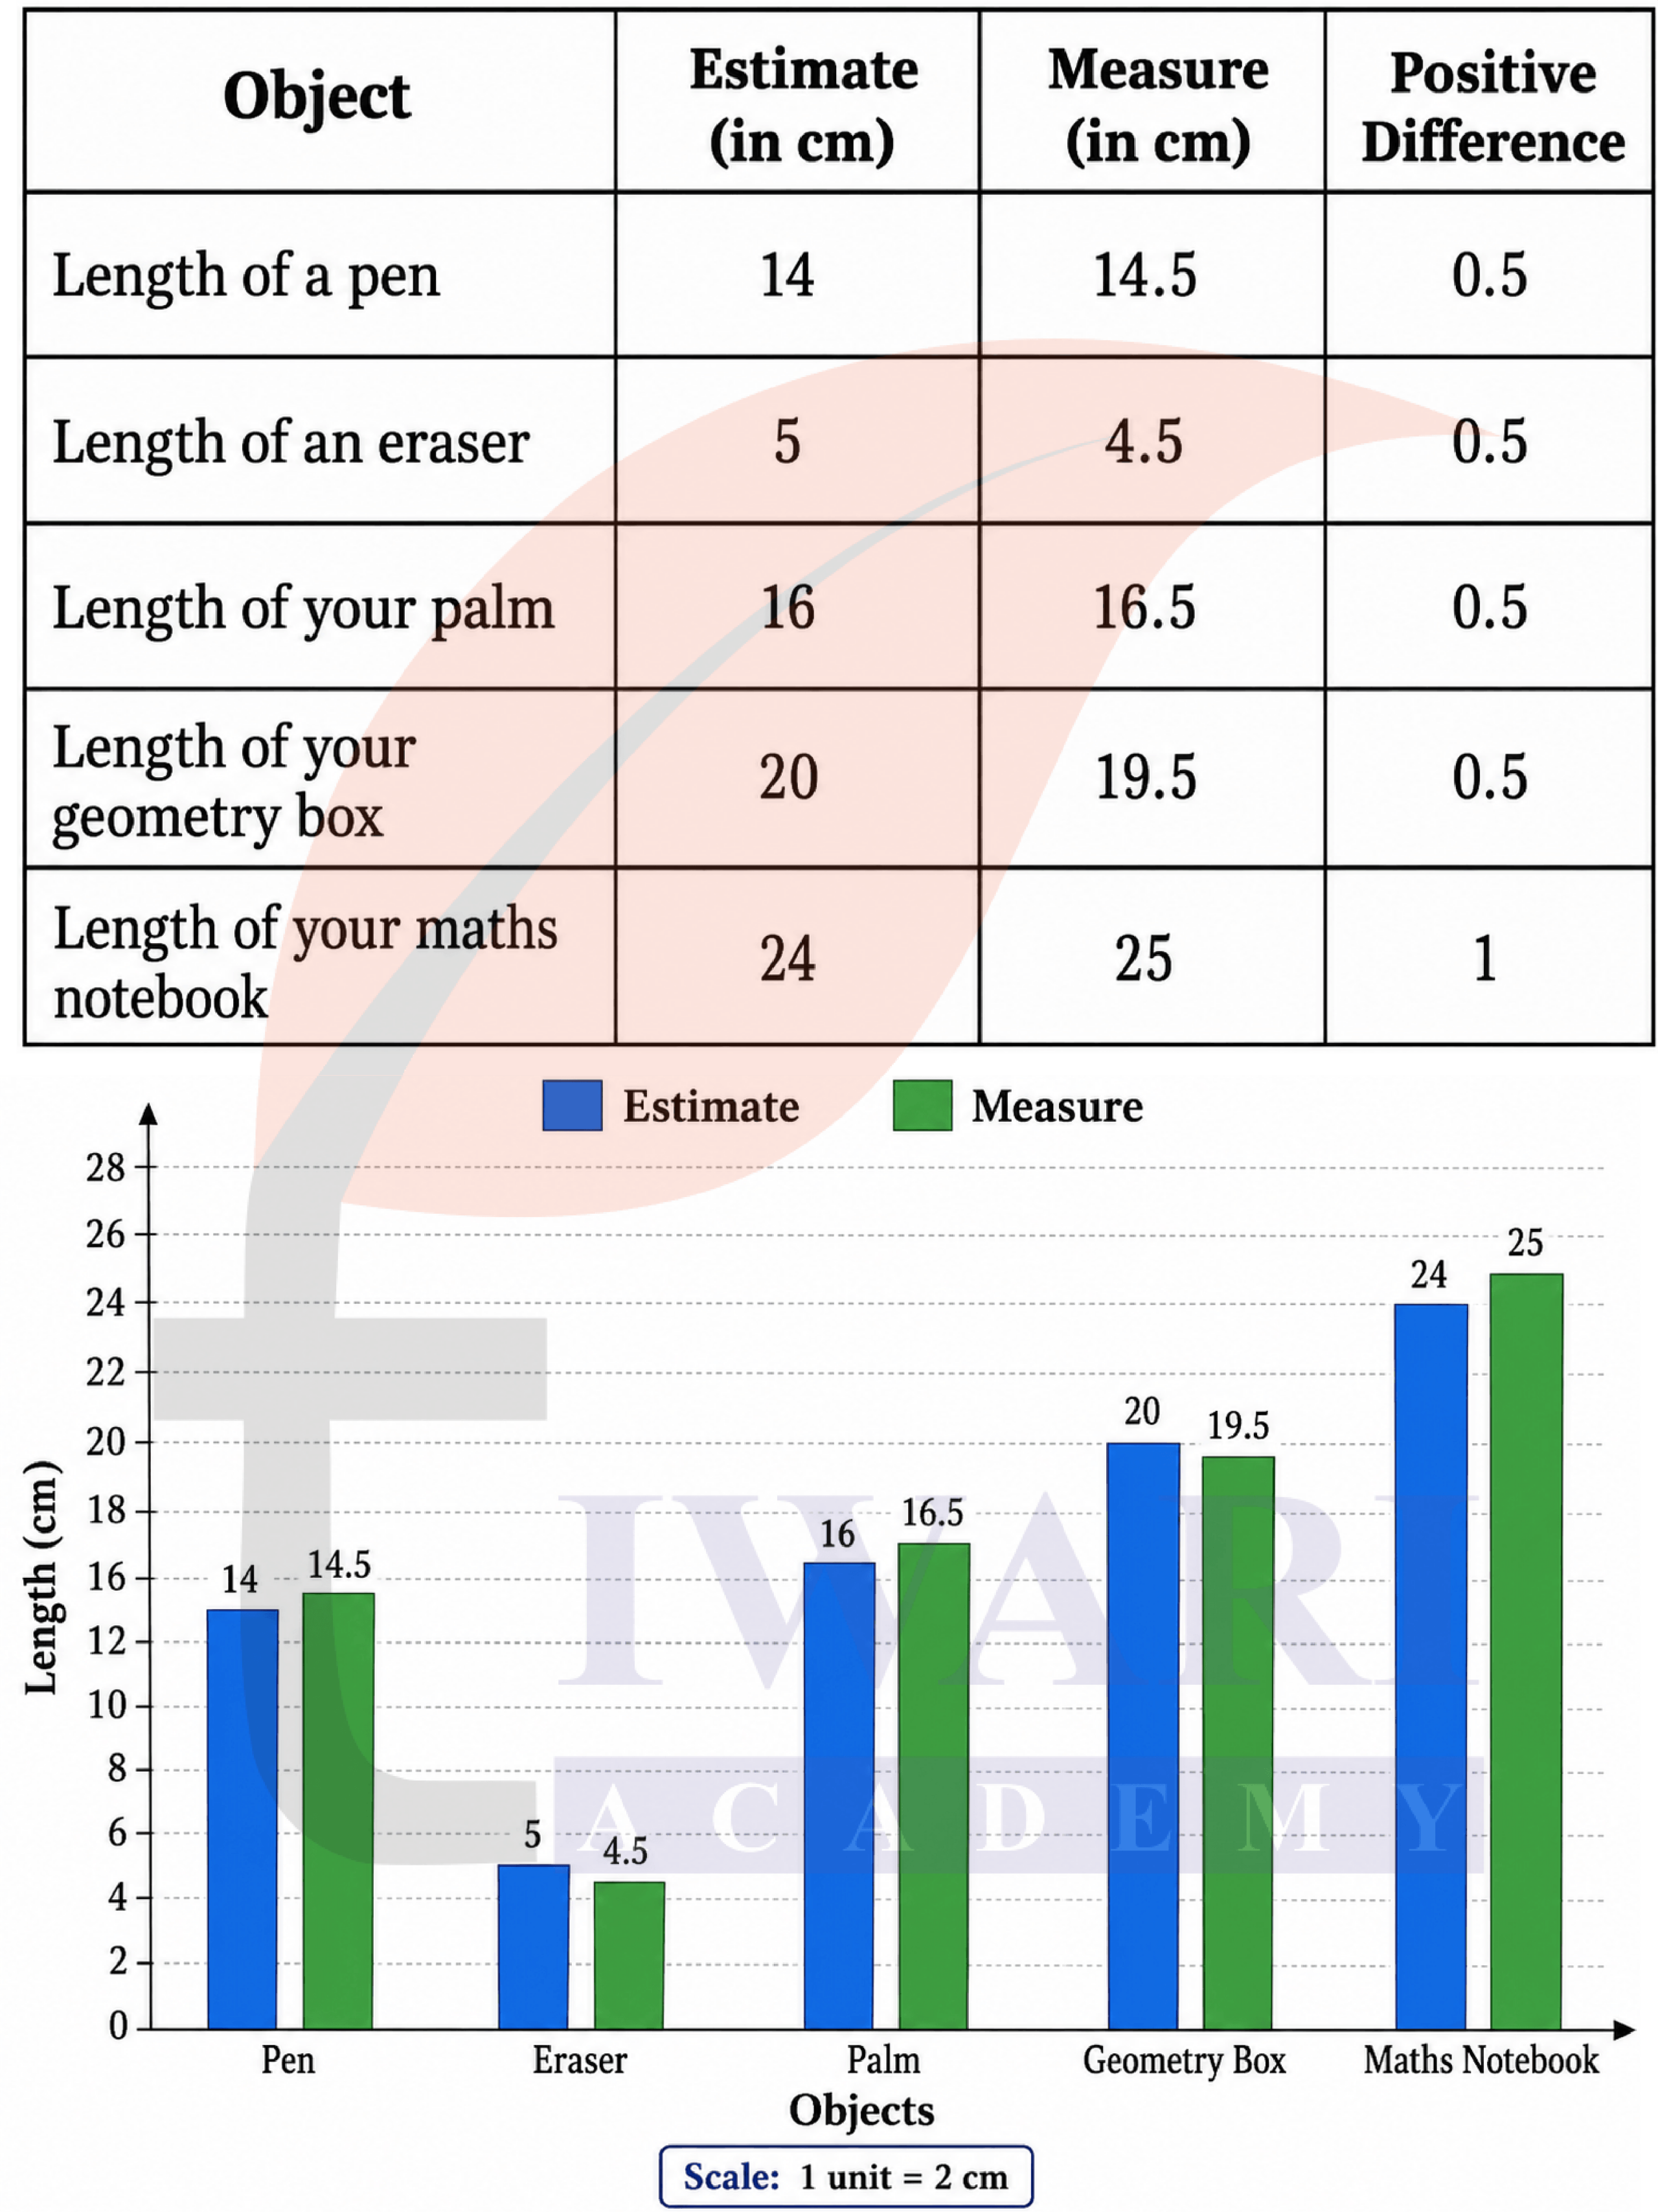
9. Estimate and then measure the objects listed in the following table. Draw a double bar graph based on the data. How accurate were your estimates? Find the average difference between the estimated and measured values.
Answer
Average difference
= (0.5 + 0.5 + 0.5 + 0.5 + 1) ÷ 5
= 3 ÷ 5
= 0.6 cm
So, the estimates were quite accurate, because every estimate was within 1 cm of the measured value. The average error was only 0.6 cm.
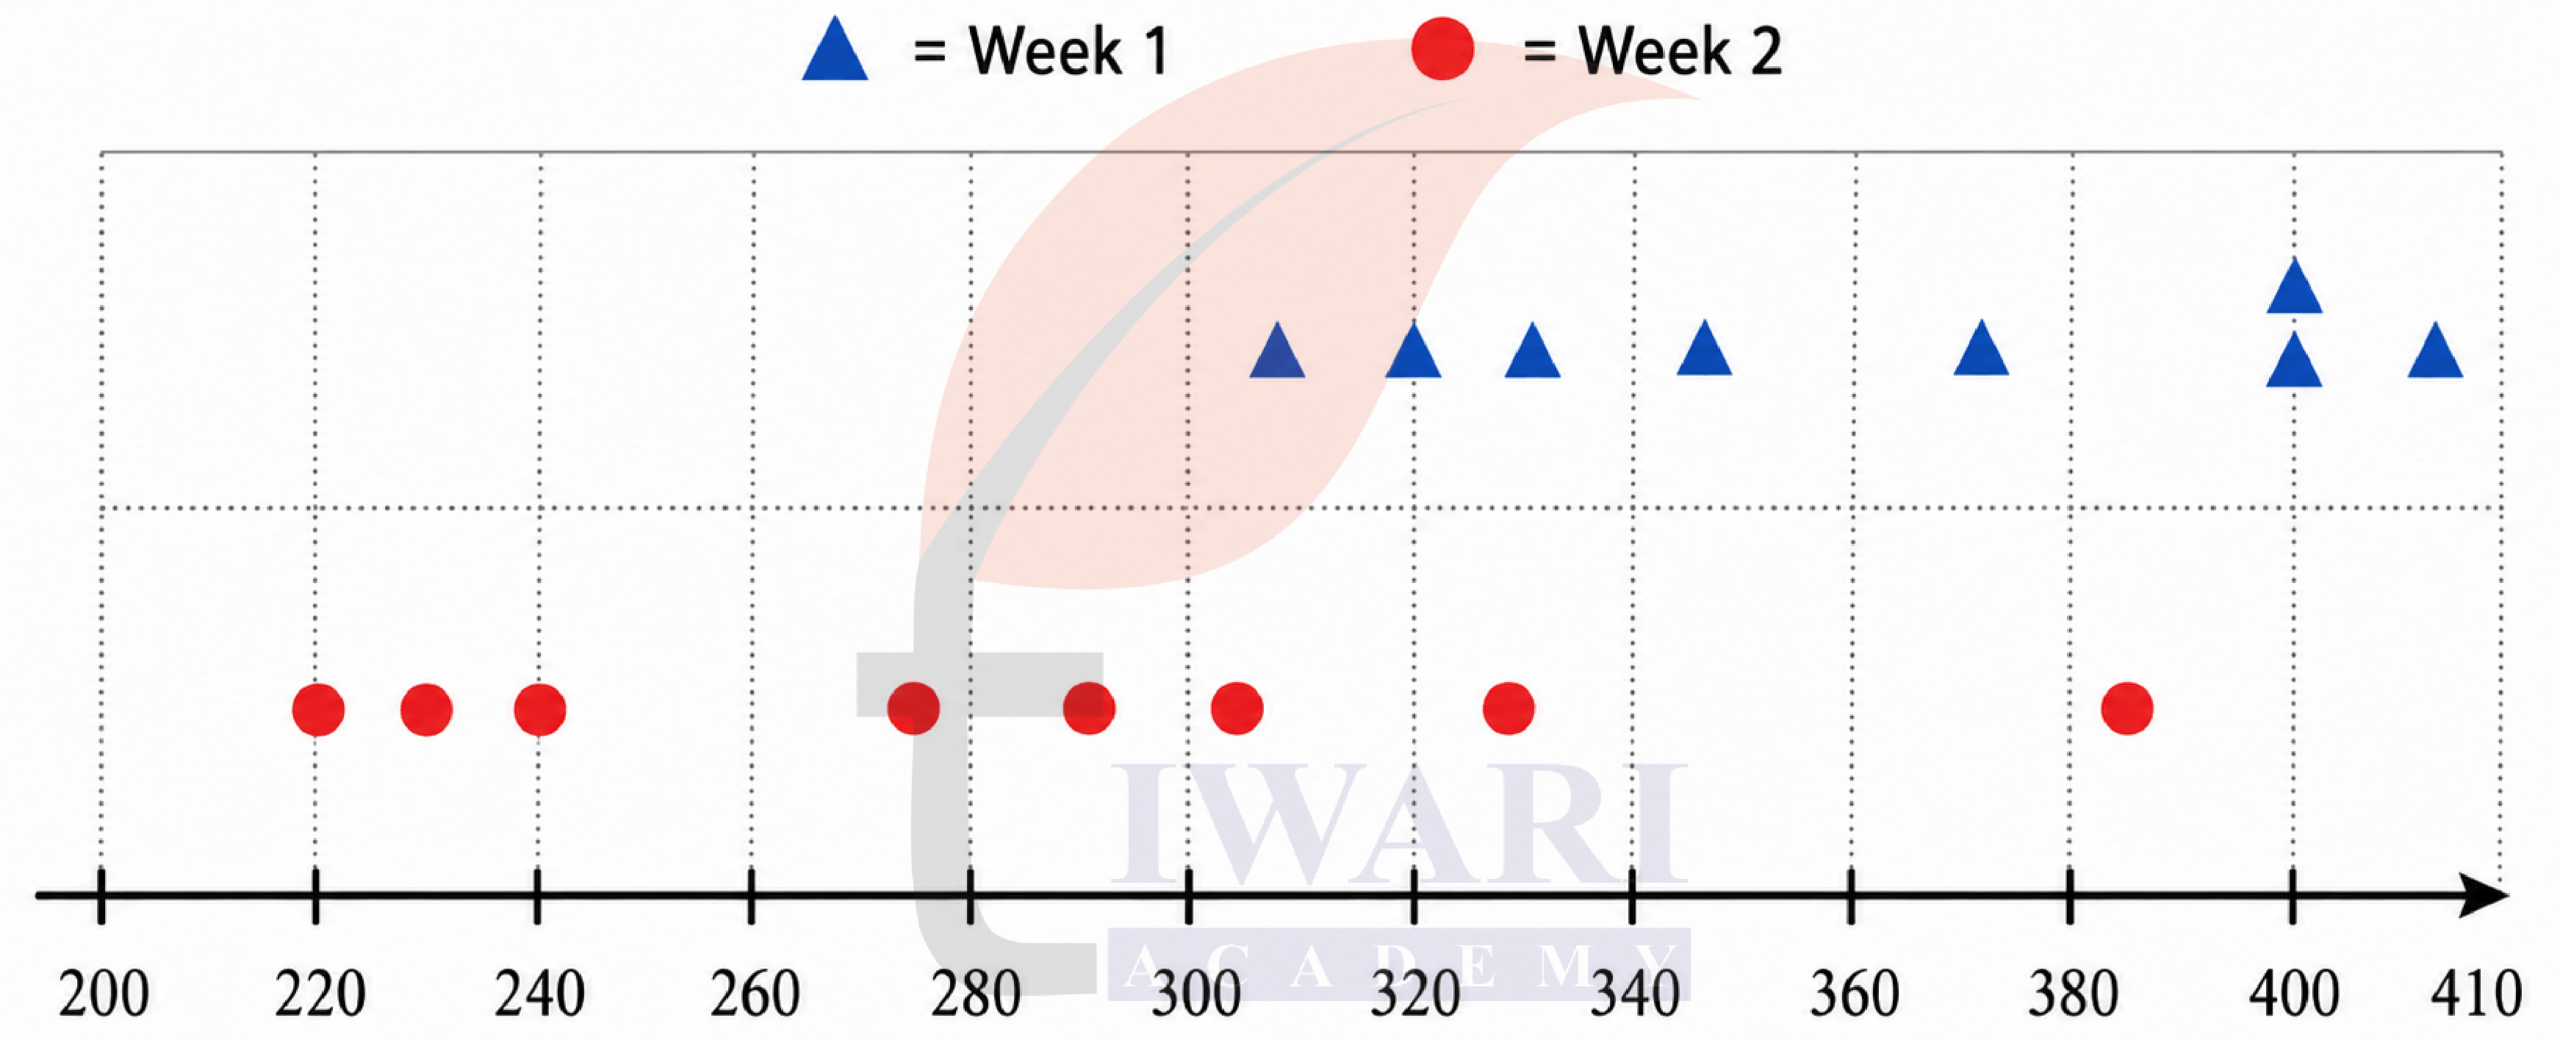
10. Aditi likes solving puzzles. She recently started attempting the ‘Easy’ level Sudoku puzzles. The time she took (in seconds) to solve these puzzles are: 410, 400, 370, 340, 360, 400, 320, 330, 310, 320, 290, 380, 280, 270, 230, 220, 240. The first nine values correspond to Week 1 and the rest to Week 2.
(a) Construct a dot plot below showing the data for both weeks.
(b) Describe the mean, median, and any observations you may have about the data.

Answer:
(a) Dot plot
(b) Data in ascending order: 310, 320, 330, 340, 360, 370, 400, 400, 410
Week 1
Total values = 310, 320, 330, 340, 360, 370, 400, 400, 410 = 3240
Number of values = 9
Mean = Total values/No. of values
= 3240/9 = 360 seconds
There are 9 values (odd number).
The middle value is the 5th value.
Median (Week 1) = 360 seconds
Week 2
Data in ascending order: 220, 230, 240, 270, 280, 290, 320, 380
Total values = 220, 230, 240, 270, 280, 290, 320, 380 = 2230
Number of values = 8
Mean = Total values/No. of values
Mean = 2230/8} = 278.75 seconds
There are 8 values (even number).
The median is the average of the 4th and 5th values.
Median = (270 + 280)/2 = 275 seconds
Observations
Both the mean and median have decreased from Week 1 to Week 2.
This shows that Aditi is solving puzzles faster in Week 2.
The dot plot clearly shows a leftward shift in Week 2 data, indicating improvement with practice.
Frequently Asked Questions
Is Class 7 Maths Ganita Prakash Part 2 Chapter 5 easy?
Yes, Class 7 Maths Ganita Prakash Part 2 Chapter 5, Connecting the Dots, is a relatively easy and interesting chapter because it deals with real-life data like cricket scores, heights, onion prices and rocket launches. The concepts of mean, median, dot plots and bar graphs are simple to calculate once students understand the basic formulas. Regular practice of the “Figure it Out” questions makes this chapter easy to score well in.
How to solve Class 7 Ganita Prakash Part 2 Chapter 5 in one day?
To solve Class 7 Maths Ganita Prakash Part 2 Chapter 5 in one day, first read the theory on statistical questions, mean, median and outliers carefully. Next, practice the solved Math Talk and Try This examples given in the textbook, followed by the “Figure it Out” exercises using the NCERT Solutions provided on this page. Focus on formula-based questions like finding mean and median and practice plotting dot plots and double bar graphs, as these are frequently asked and quick to revise.
What is the importance of Class 7 Maths Part 2 Chapter 5 in the half yearly exam?
Class 7 Maths Ganita Prakash Part 2 Chapter 5 holds good weightage in the half-yearly exam as it introduces core statistics concepts such as mean, median, outliers, dot plots and double bar graphs, which are commonly tested through direct numerical problems and graph-reading questions. Since this chapter builds the foundation for data handling topics in higher classes, teachers often frame at least one long-answer or graph-based question from it. Practicing all “Figure it Out” questions ensures students don’t lose easy marks.
What topics are covered in Class 7 Maths Ganita Prakash Chapter 5?
Class 7 Maths Ganita Prakash Part 2 Chapter 5, Connecting the Dots, covers statistical questions and statements, representative values such as arithmetic mean and average as fair-share, outliers and median, measures of central tendency and data visualisation through dot plots and clustered or double bar graphs. The chapter also includes real-world data sets on cricket scores, onion prices, heights, rocket launches and daylight hours, helping students learn how to describe, compare and interpret data using minimum, maximum, mean and median values.
Is Class 7 Maths Ganita Prakash Part 2 Chapter 5 important for Class 8?
Yes, Class 7 Maths Ganita Prakash Part 2 Chapter 5 is important for Class 8 because it lays the groundwork for more advanced statistics and data handling topics, including measures of central tendency, probability and data interpretation. A clear understanding of mean, median, outliers and graph reading in this chapter makes it much easier to grasp complex statistical concepts, frequency distributions and data-based word problems introduced in Class 8 and beyond, making this chapter a valuable long-term investment.