NCERT Solutions for Class 6 Maths Chapter 9 Exercise 9.1 in Hindi and English Medium updated for CBSE session 2025-26. Class 6th mathematics ex. 9.1 is revised according to rationlised syllabus and new NCERT books for CBSE 2025-26.
6th Maths Exercise 9.1 Solutions in Hindi and English Medium
| Class: 6 | Mathematics |
| Chapter: 9 | Exercise: 9.1 |
| Topic Name: | Data Handling |
| Content Type: | PDF and Videos Solution |
| Session: | CBSE 2025-26 |
| Medium: | Hindi and English Medium |
Class 6 Maths Chapter 9 Exercise 9.1 Solution
Class VI Mathematics NCERT textbook Ex. 9.1 of Data Handling updated for CBSE session 2025-26 free to download as well as study online. All the questions are solved step by step in PDF as well as in explanation videos. NCERT Book Class 6 Maths exercises 9.1 all the questions are explained in simple format using explanation videos. In NCERT (https://ncert.nic.in/) PDF solutions also our subject experts have used simple steps to solve the questions.
Data
A data means information in the form of numerical figures.
Example:
The weights (in kg) of 10 students of a class are:
42, 36, 34, 45, 48, 52, 39, 40, 43, 47,
We call it the data related to the weights of 10 students of a class.
Raw Data
Data obtained in the original form is called raw data. Data given in the above examples are raw data.
Observations
Each numerical figure in a data is called an observation.
Array
Arranging the numerical figures in an ascending or a descending order is called an array.
Tabulation of Data
Arranging the data in a systematic form in the form of a table is called tabulation or presentation of the data.
Class 6 Maths Exercise 9.1 Important Questions
What are the types of data handling?
Types of Data Handling:
Bar Graph.
Pictograph.
Line Graph.
Stem and Leaf Plots.
Histogram.
Dot Plots.
Cumulative Tables and graphs.
Frequency Distribution.
What is the importance of data handling?
Data handling is important in ensuring the integrity of research data since it addresses concerns related to confidentially, security, and preservation/retention of research data. Proper planning for data handling can also result in efficient and economical storage, retrieval, and disposal of data.
How does data handling relate to real life?
When you relate observations to your school data or real-life examples, you can understand its usage practically. Lat’s study some practical examples of data handling. The number of pastries remaining after your school baking sale.
(i) Voter Polls
(ii) Marketing Surveys
(iii) The temperature of different cities in your country.
Frequency of an observation
The number of times a particular observation occurs is called its frequency.
Example:
Following are the number of members in 20 families in a village.
6, 8, 6, 3, 2, 5, 7, 8, 6, 5, 7, 5, 7, 6, 8, 7, 6, 6, 7, 5
Arrange the above data in an ascending order and then put it in the tabular form.
Ans: Arranging the data in an ascending order, we get the given data as
2, 3, 5, 5, 5, 5, 6, 6, 6, 6, 6, 6, 7, 7, 7, 7, 7, 8, 8, 8
How many examples are based on exercise 9.1 of 6th standard Maths NCERT Textbook?
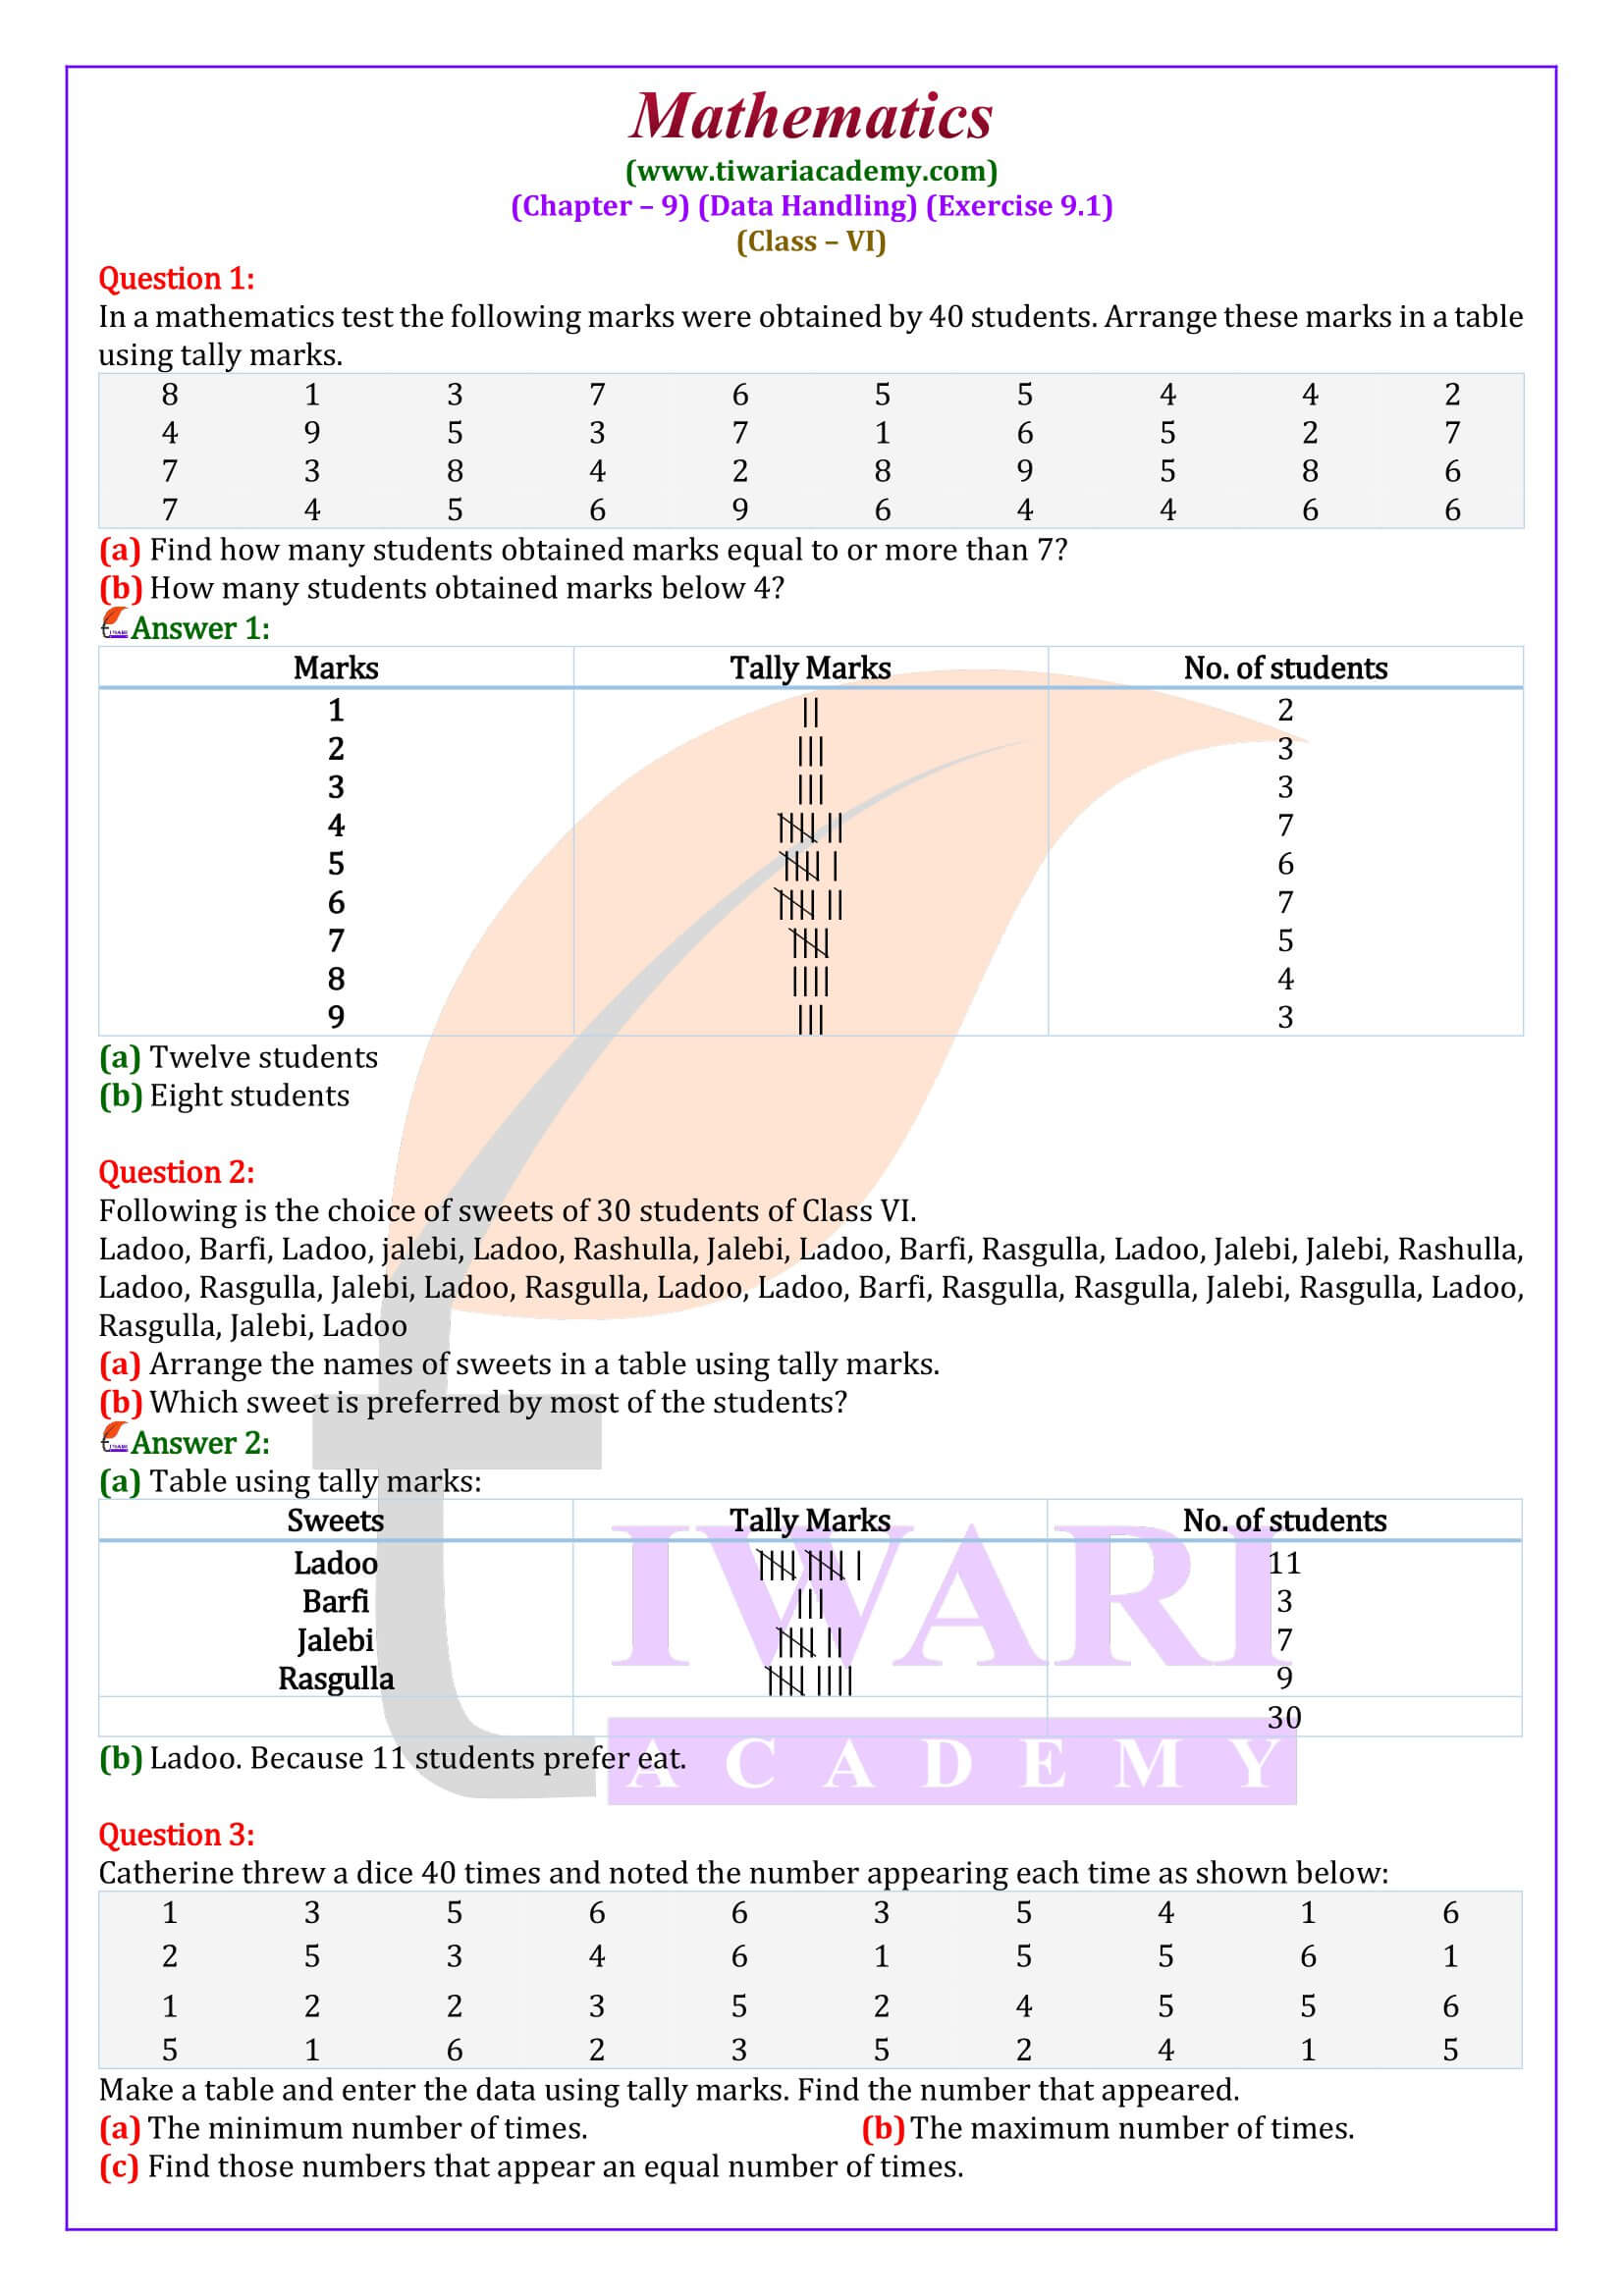
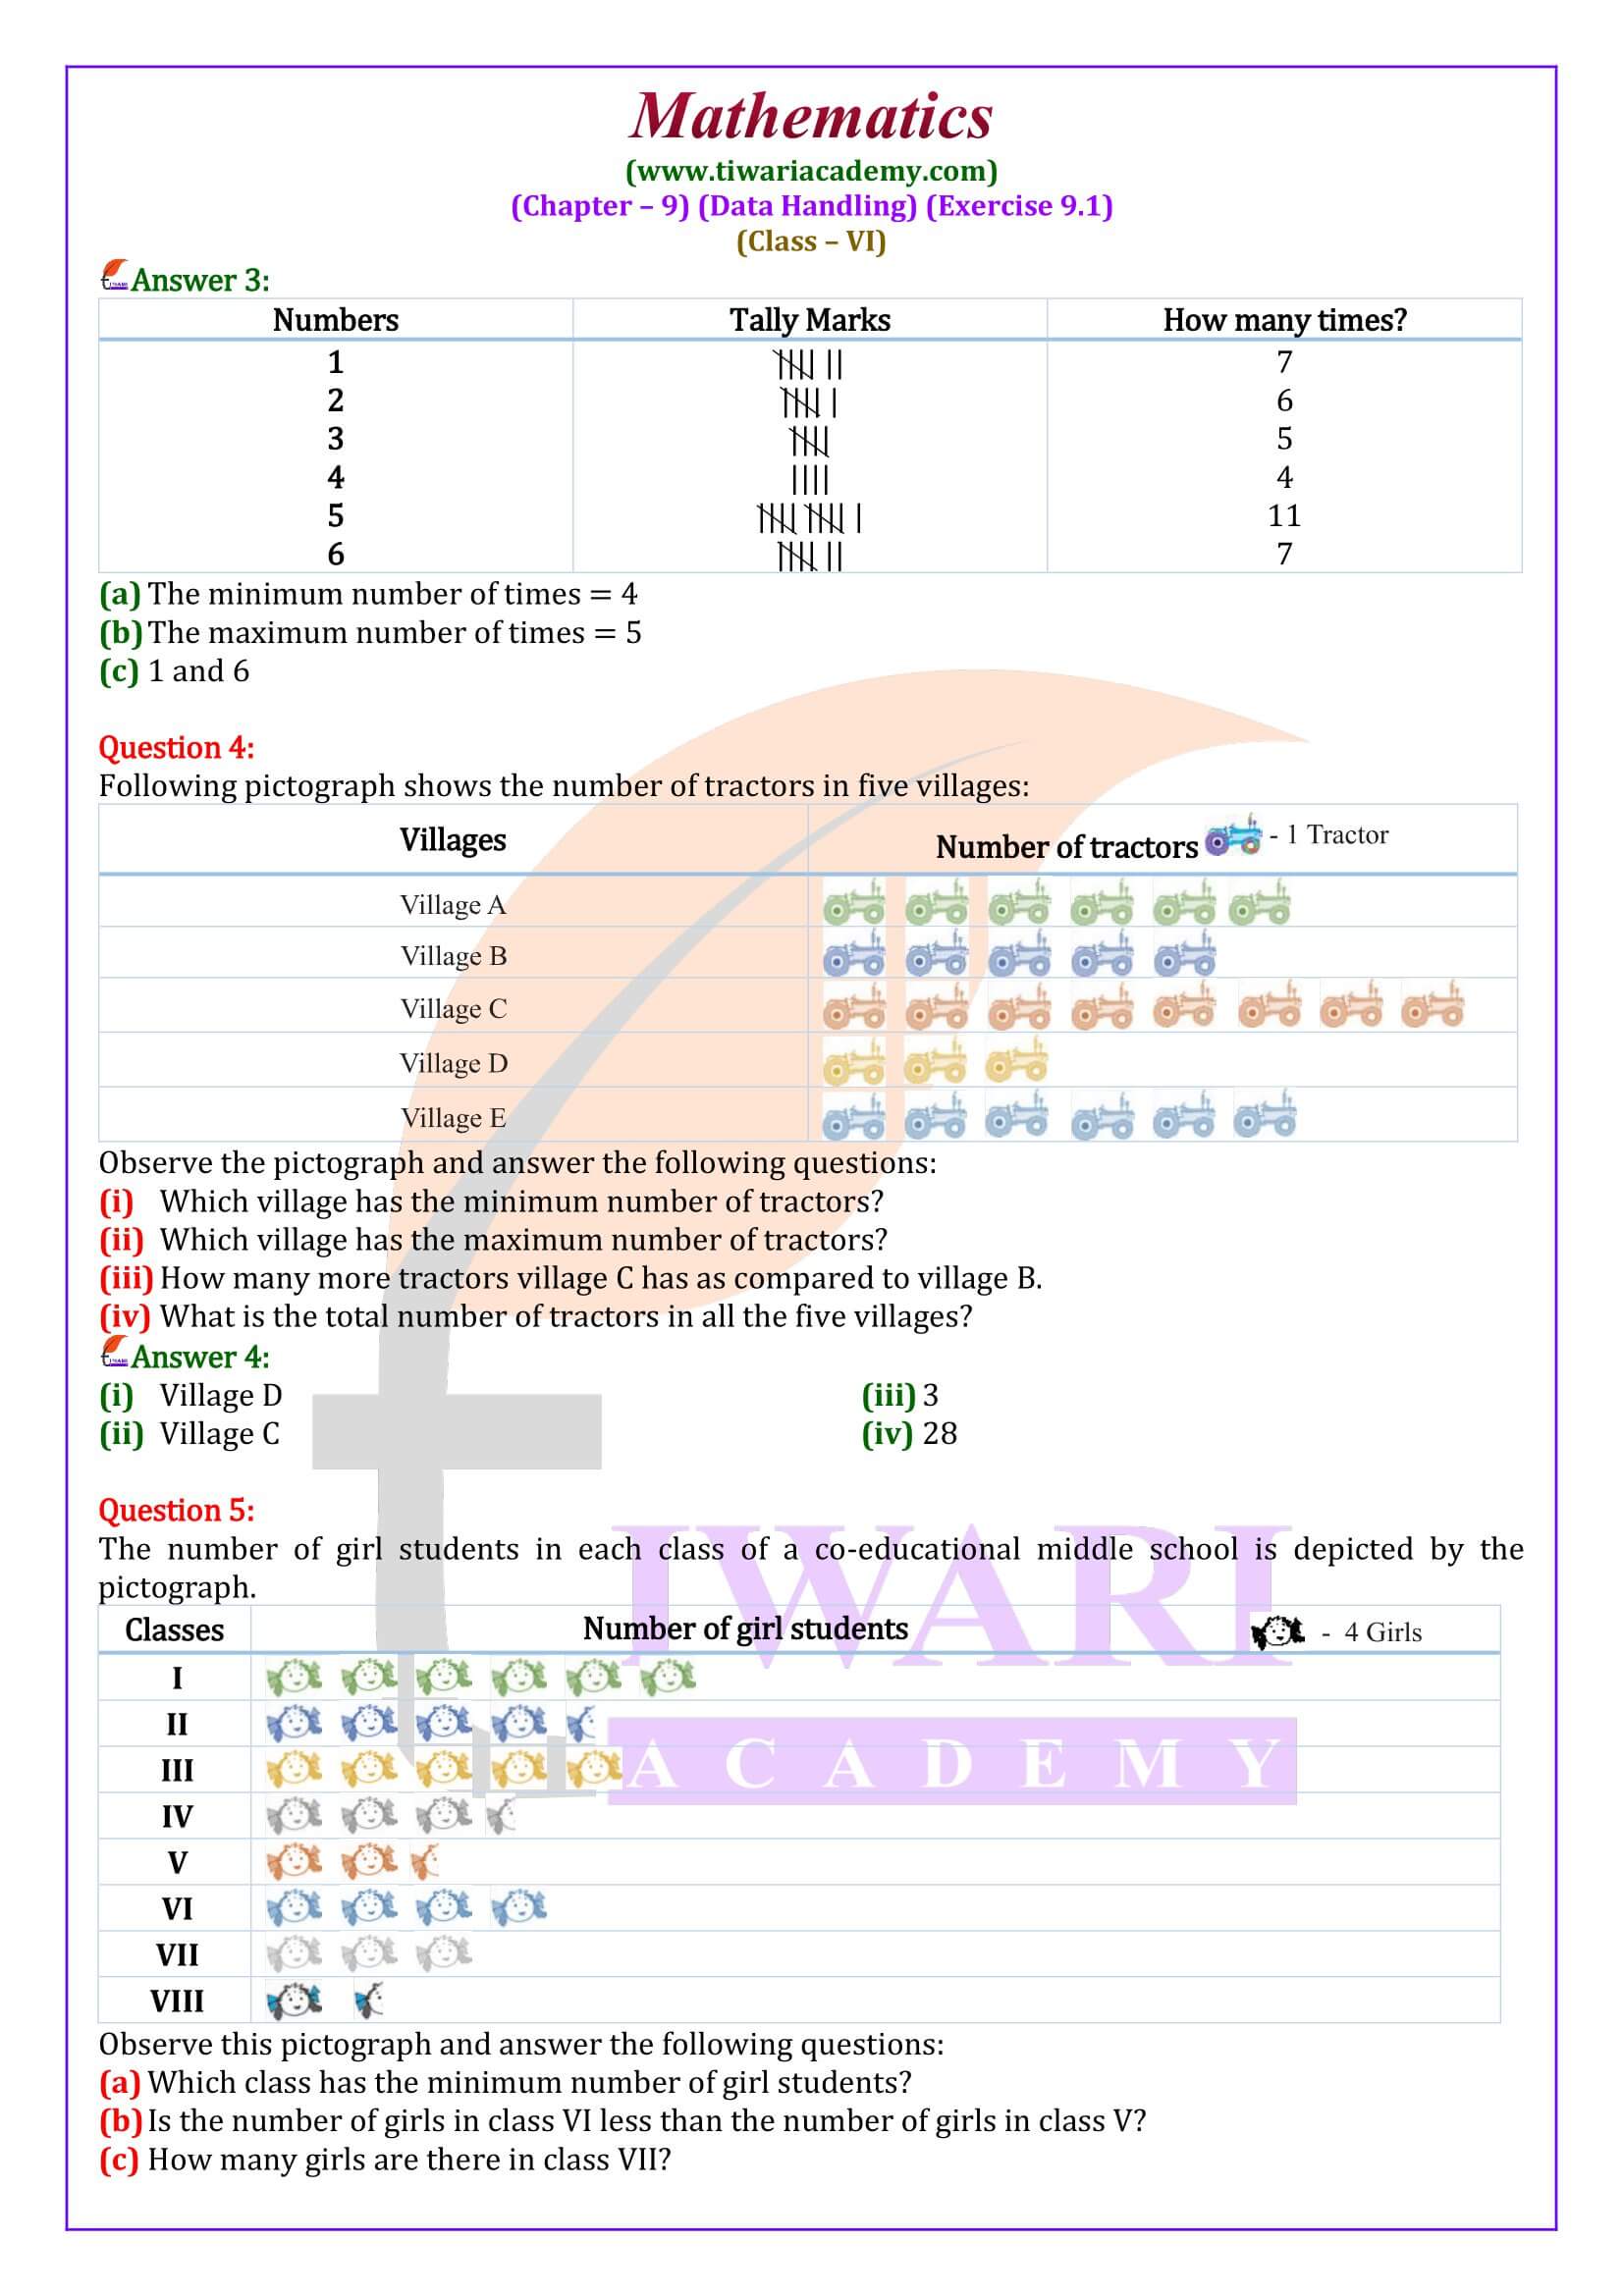
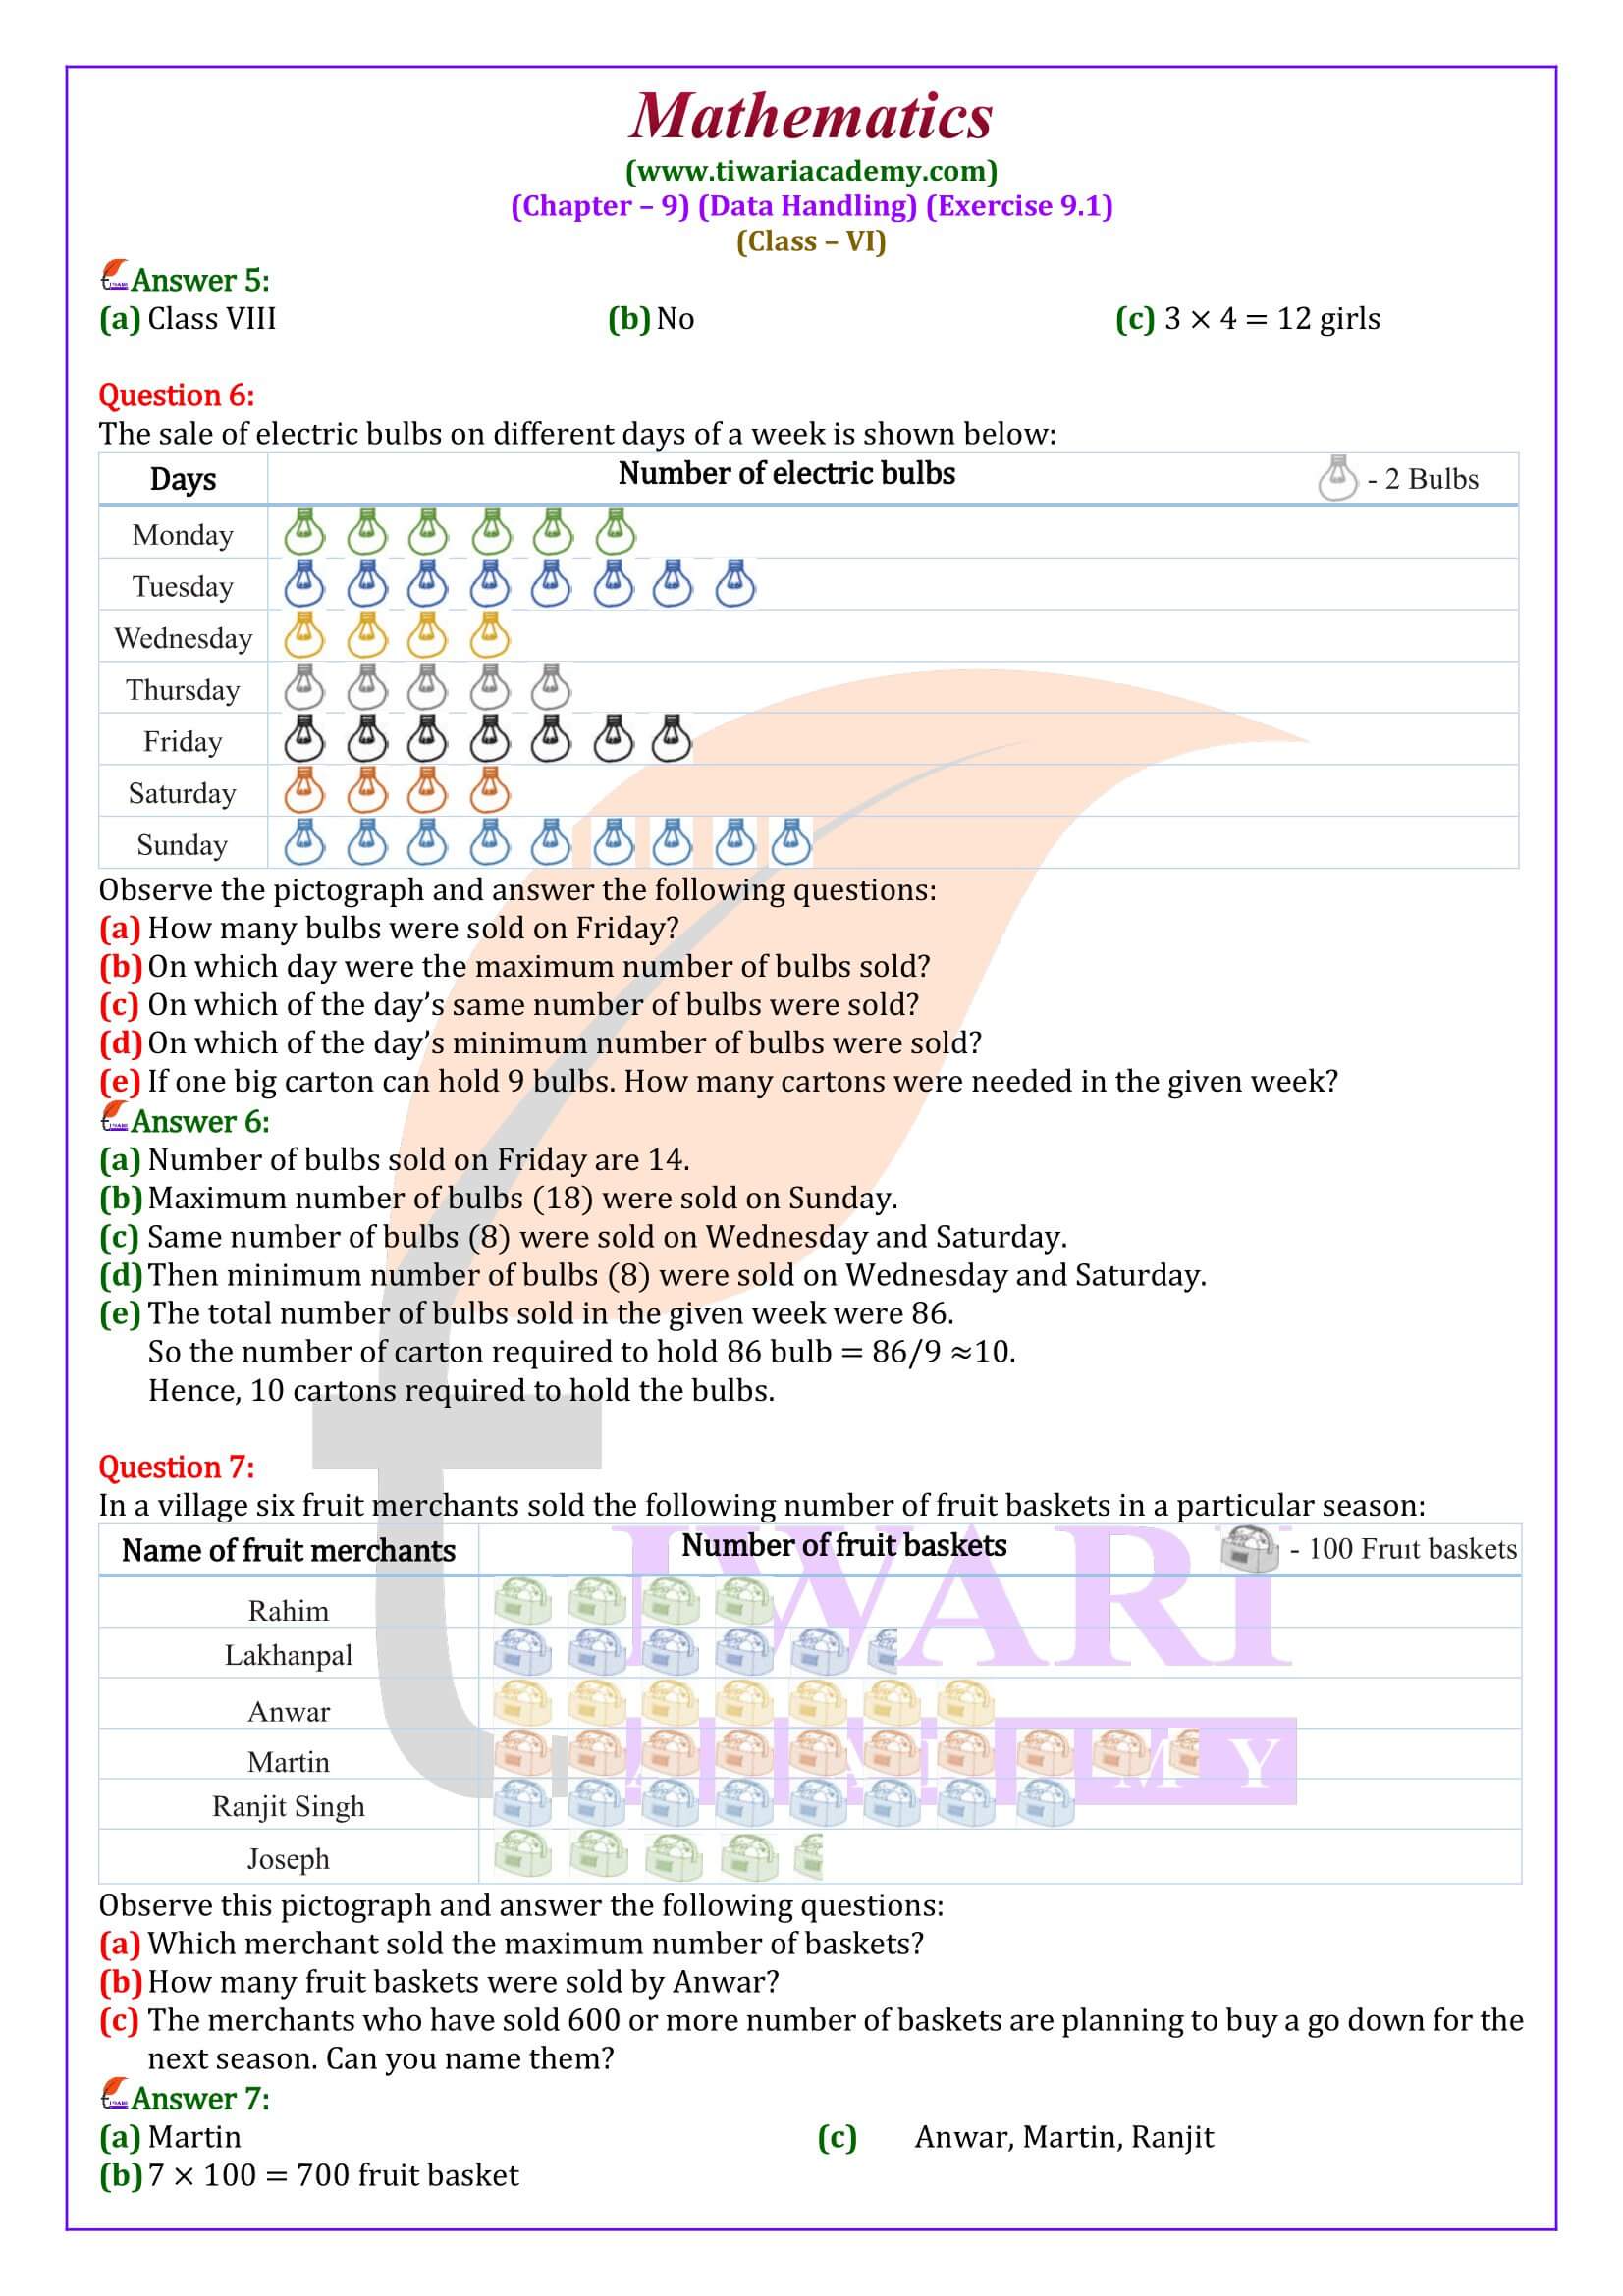
In chapter 9 of 6th standard Maths, there is a total of ten examples out of which the first 6 examples (examples 1, 2, 3, 4, 5, 6) are based on exercise 9.1 of 6th standard Maths. Examples 1, 2 are of tally marks, and examples 3, 4, 5 are of pictographs.
Is exercise 9.1 of Class 6 Maths lengthy or short?
Exercise 9.1 of grade 6th Maths is not very lengthy and not very short. Exercise 9.1 has total 13 problems (7 questions and 6 examples (examples 1, 2, 3, 4, 5, 6)). Students require a maximum of 2 days to complete exercise 9.1 of grade 6th Maths if they give 1 hour per day to this exercise.
Can students easily solve exercise 9.1 of grade 6th Maths?
Yes, students can easily solve exercise 9.1 of grade 6th Maths. All examples and questions of this exercise are very easy. Students can quickly solve all the problems (6 examples and 7 questions) of this exercise. All the problems of this exercise are based on tally marks and pictographs.
What is the pictograph in exercise 9.1 of class 6 Maths NCERT?
A pictograph represents data through pictures of objects. It helps to answer the questions on the data at a glance. Pictographs are often used by dailies and magazines to attract the reader’s attention.


