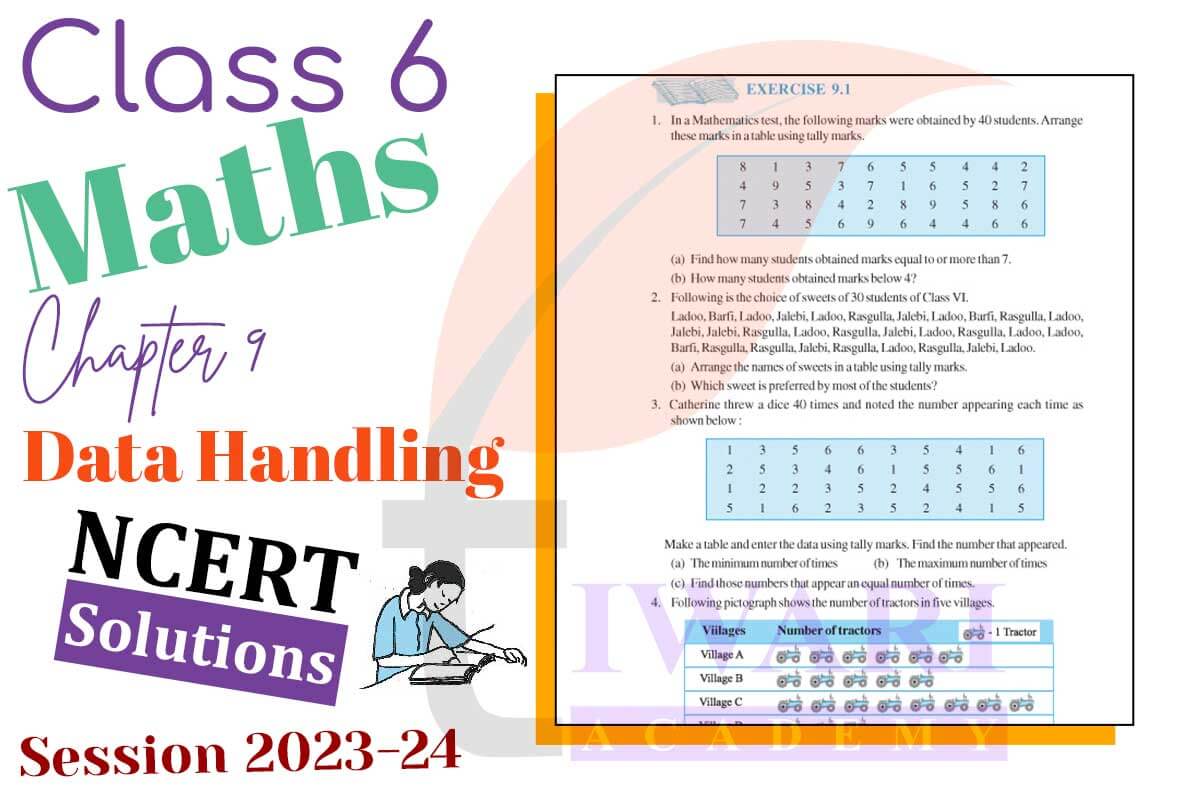
NCERT Solutions for Class 6 Maths Chapter 9 Data Handling prepared for new session 2025-26 with Topic wise tests in Hindi and English Medium. According to the revised syllabus in class 6 Maths, there are only one exercise in chapter 9 Data Handling given in NCERT textbook 2025-26.
Class 6 Maths Chapter 9 Solutions for CBSE Board
Class 6 Maths Chapter 9 Solutions for State Boards
Class 6 Maths Chapter 9 Practice Test
6th Maths Chapter 9 Test 1
6th Maths Chapter 9 Test 2
6th Maths Chapter 9 Test 3
6th Maths Chapter 9 Test 4
6th Maths Chapter 9 Test 5
6th Maths Chapter 9 Test 6
| Class: 6 | Mathematics |
| Chapter 9: | Data Handling |
| Number of Exercises: | 1 (One) |
| Content: | Textbook Exercises Solution |
| Mode of content: | Online Videos and Text format |
| Academic Sesion: | CBSE 2025-26 |
| Medium: | Hindi and English Medium |

NCERT Solutions for Class 6 Maths Chapter 9
Class VI Mathematics Exercise 9.1 in English Medium as well as Hindi Medium updated for new academic session. Solutions of Prashnavali 9.1 in Hindi Medium to free download in PDF. All the solutions have been updated for the CBSE session based on latest NCERT Textbooks 2025-26 downloaded from official website (https://ncert.nic.in/). Download 6 all subject’s offline apps in Hindi and English medium also. Videos related to all exercises of Chapter 9 Class 6 is also given for better understanding.
Download Class 6 Maths Chapter 9 Solutions in PDF
Download NCERT Solutions for Class 6 Mathematics Chapter 9 Data Handling in PDF format updated for the students of new session 2025-26 following the latest NCERT Books. Provide feedback to us for betterment of website. We are working to make study easier in all the subjects.

About Class 6 Maths Chapter 9
In 6 Maths NCERT Chapter 9 Data Handling, we will study about the ways to record raw data and how to use this data to interpret the result and predict further results. Organization of data using tally marks and frequency distribution then interpret it into pictograph and bar graph.
Pictograph: A pictograph represents data through pictures of objects. It helps answer the questions on the data at a glance.
Bar Graph: Bars of uniform width are drawn horizontally or vertically with equal spacing between them and then the length of each bar represents a particular number. Such method of representing data is called a bar diagram or a bar graph. To represent this we use the process of choosing a scale for the graph. For example, 1 unit on the graph = 100 actual units. We should learn how to read a given bar graph.
Note: To get a particular information from the given data quickly, the data can be arranged in a tabular form using tally marks.
Important Questions on Class 6 Maths Chapter 9
What is data?
A data is a collection of numbers gathered to give some information.
What is a pictograph?
A pictograph represents data through pictures of objects. It helps answer the questions on the data at a glance.
What is a bar graph?
Representing data by pictograph is not only time consuming but at times difficult too. Bars of uniform width can be drawn horizontally or vertically with equal spacing between them and then the length of each bar represents the given number. Such method of representing data is called a bar diagram or a bar graph.
Help & Suggestions
We always work for student’s help in all the way. No login and password is required on this website. solutions are downloadable as well as Online to read. All the things are in accordance with easiness. For any further suggestion, please contact us.
What is Data Handling in chapter 9 of class 6th Maths?
Data handling refers to the process of presenting, gathering and, recording information in a way that is useful to others – for instance, in graphs or charts.
Sometimes Data handling is also called statistics and you will often come across it in the study of both Mathematics and Science.
Data handling is a set of skills, which includes:
- Collecting data using a planned methodology.
- Recording data with precision and accuracy.
- Analyzing data to draw conclusions.
- Sharing data in a way that is useful to others.
What topics do teachers teach under chapter 9 of 6th standard Maths Book?
The topics that teachers teach under chapter 9 of 6th standard Maths are:
1. Definition of Data
2. Recording Data
3. Organization of Data
4. Pictograph
5. Interpretation of a Pictograph
6. Drawing a Pictograph
7. A Bar Graph
8. Interpretation of a Bar Graph
9. Drawing a Bar Graph.
How many exercises are there in chapter 9 of Class 9 Maths NCERT?
According to new syllabus of class 6th Maths, the chapter 9 has only one exercise. The only exercise (Ex 9.1) has the highest number of questions as compared to others.
Are there any examples in chapter 9 of 6th standard Maths?
Yes, Chapter 9 of 6th standard Maths has 6 examples. All examples are good and logical. These examples help students to solve and understand exercise questions.


