by Tiwari Academy Team
NCERT Solutions for Class 8 Maths Chapter 13 Exercise 13.1 Introduction to Graphs in Hindi and English Medium updated for CBSE session 2026-27. Get here the revised solutions of ex. 13.1 class 8th mathematics based on new syllabus and NCERT books issued for CBSE 2026-27.
8th Maths Exercise 13.1 Solution in Hindi and English Medium
| Class: 8 | Mathematics |
| Chapter: 13 | Exercise: 13.1 |
| Topic Name: | Introduction to Graphs |
| Content Type: | Text, PDF and Videos Solutions |
| Session: | CBSE 2026-27 |
| Medium: | Hindi and English Medium |
Class 8 Maths Chapter 13 Exercise 13.1 Solution
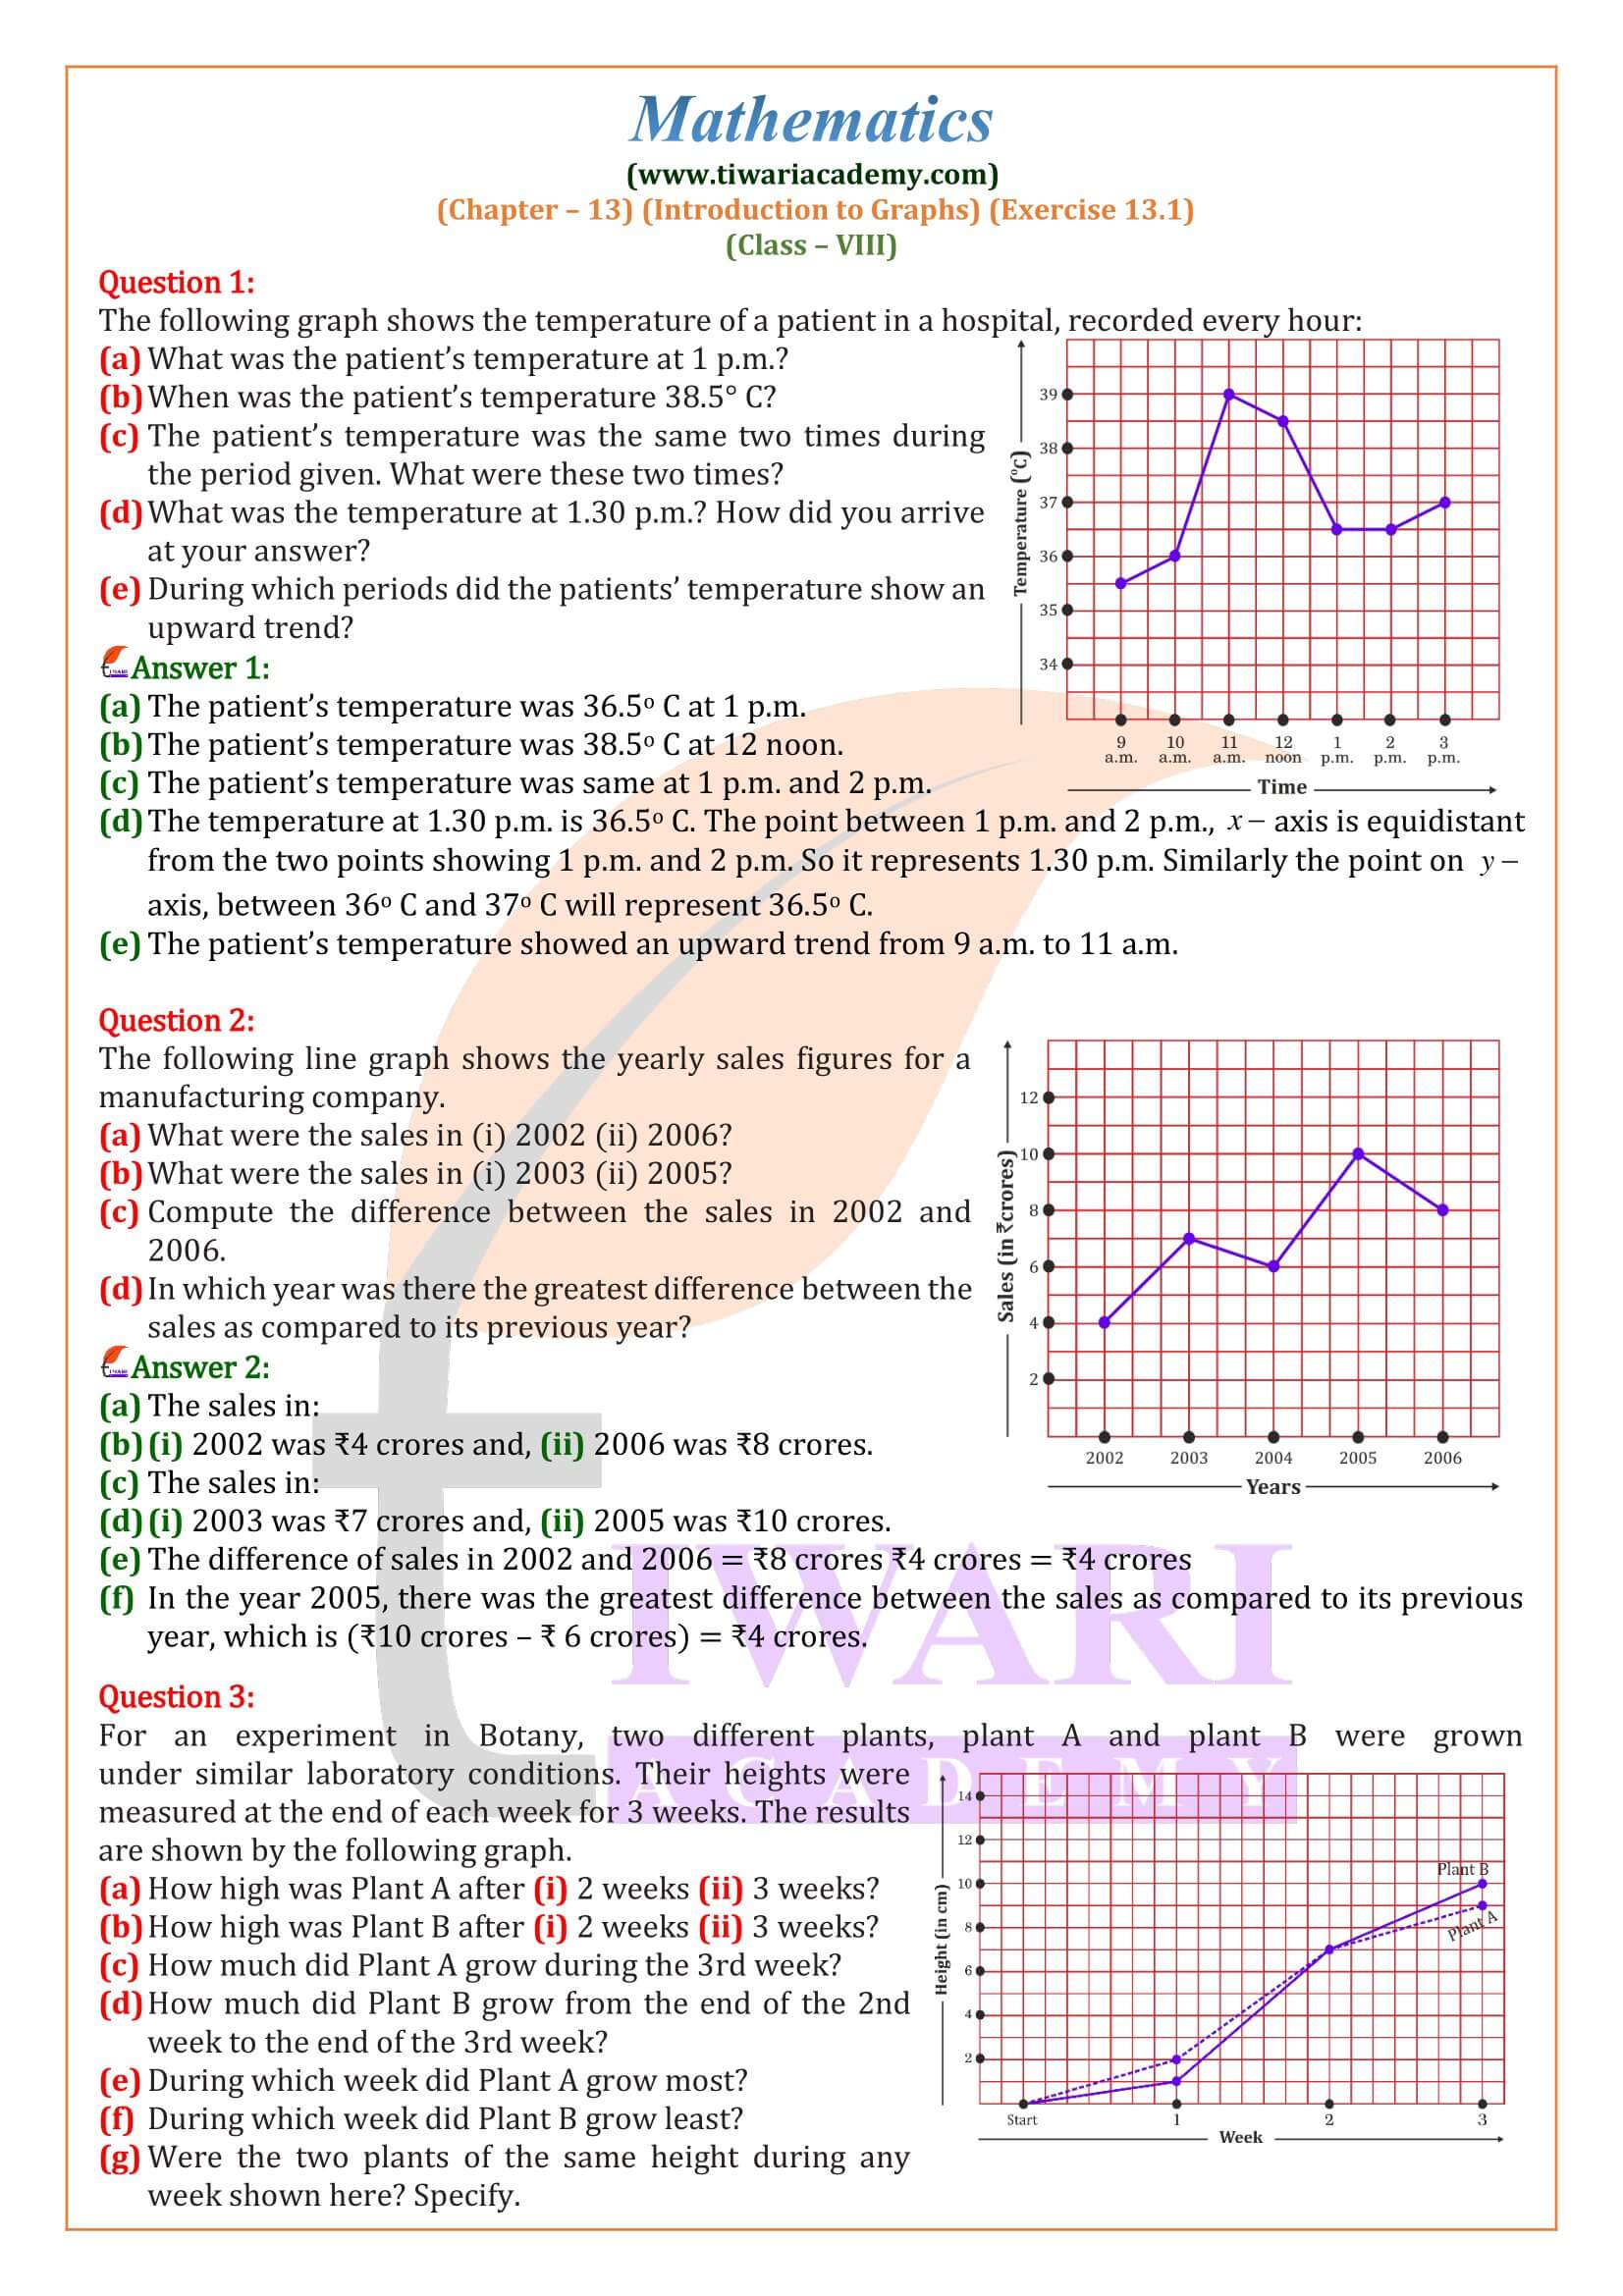
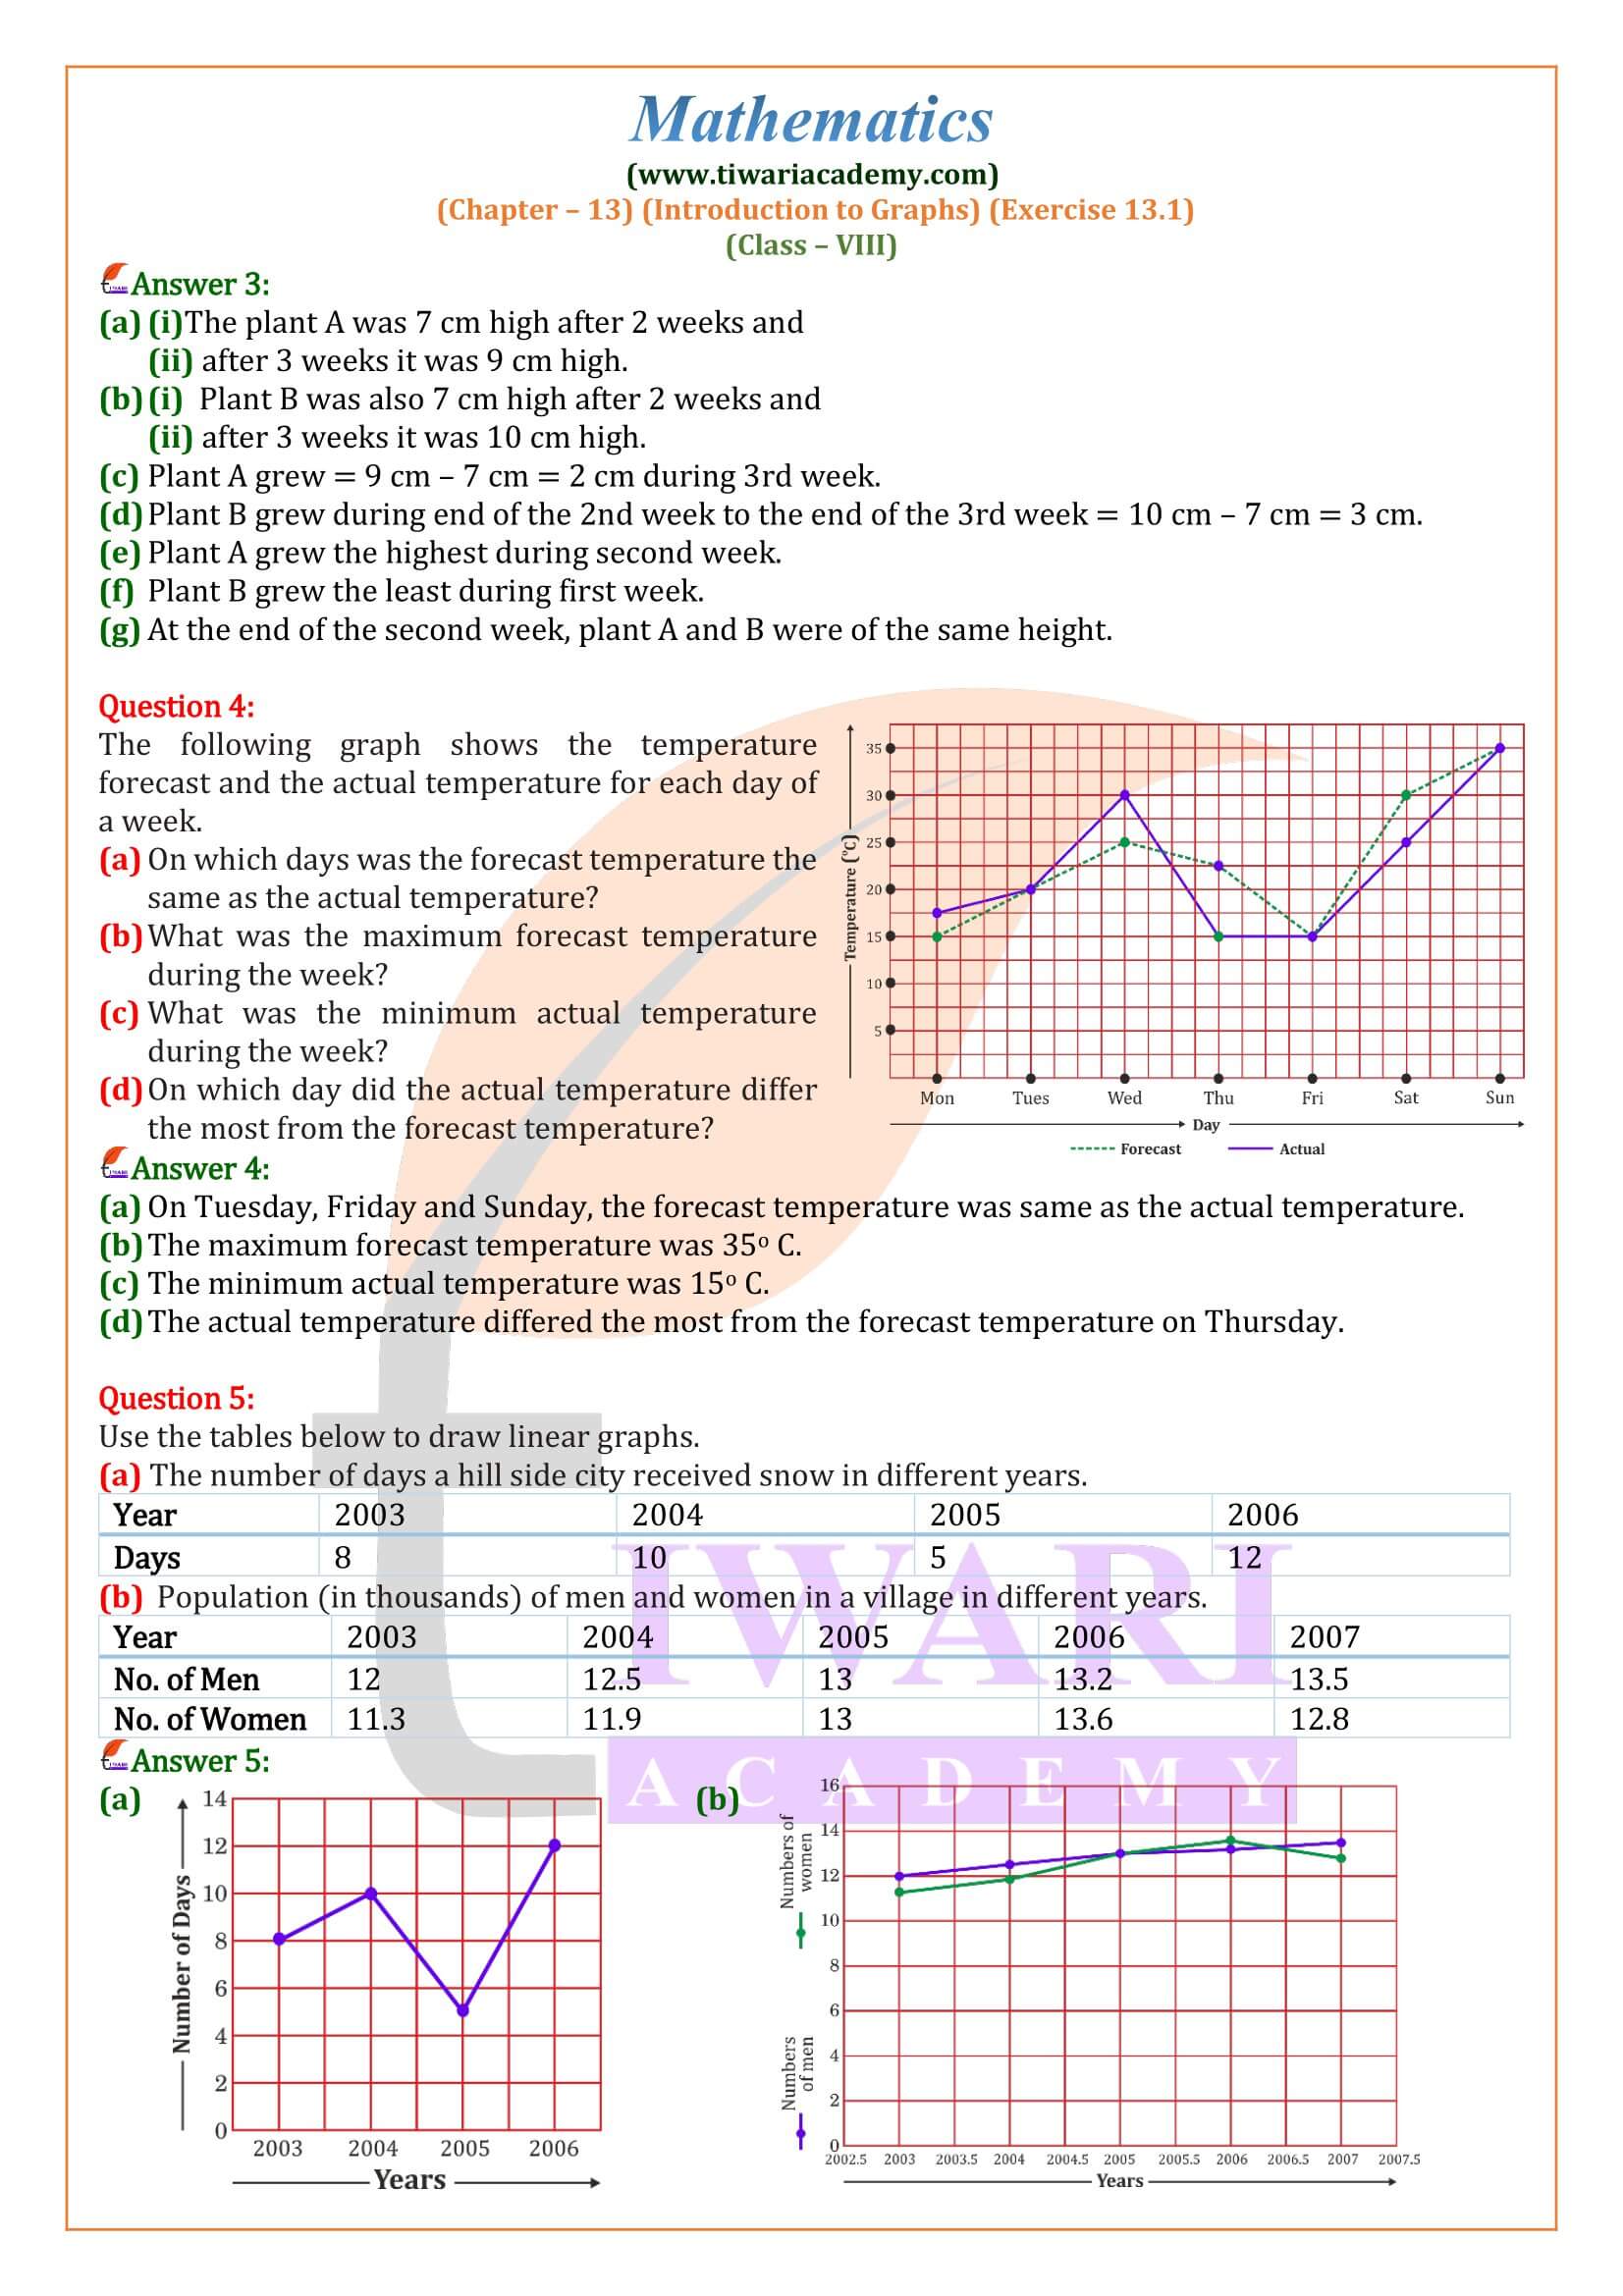
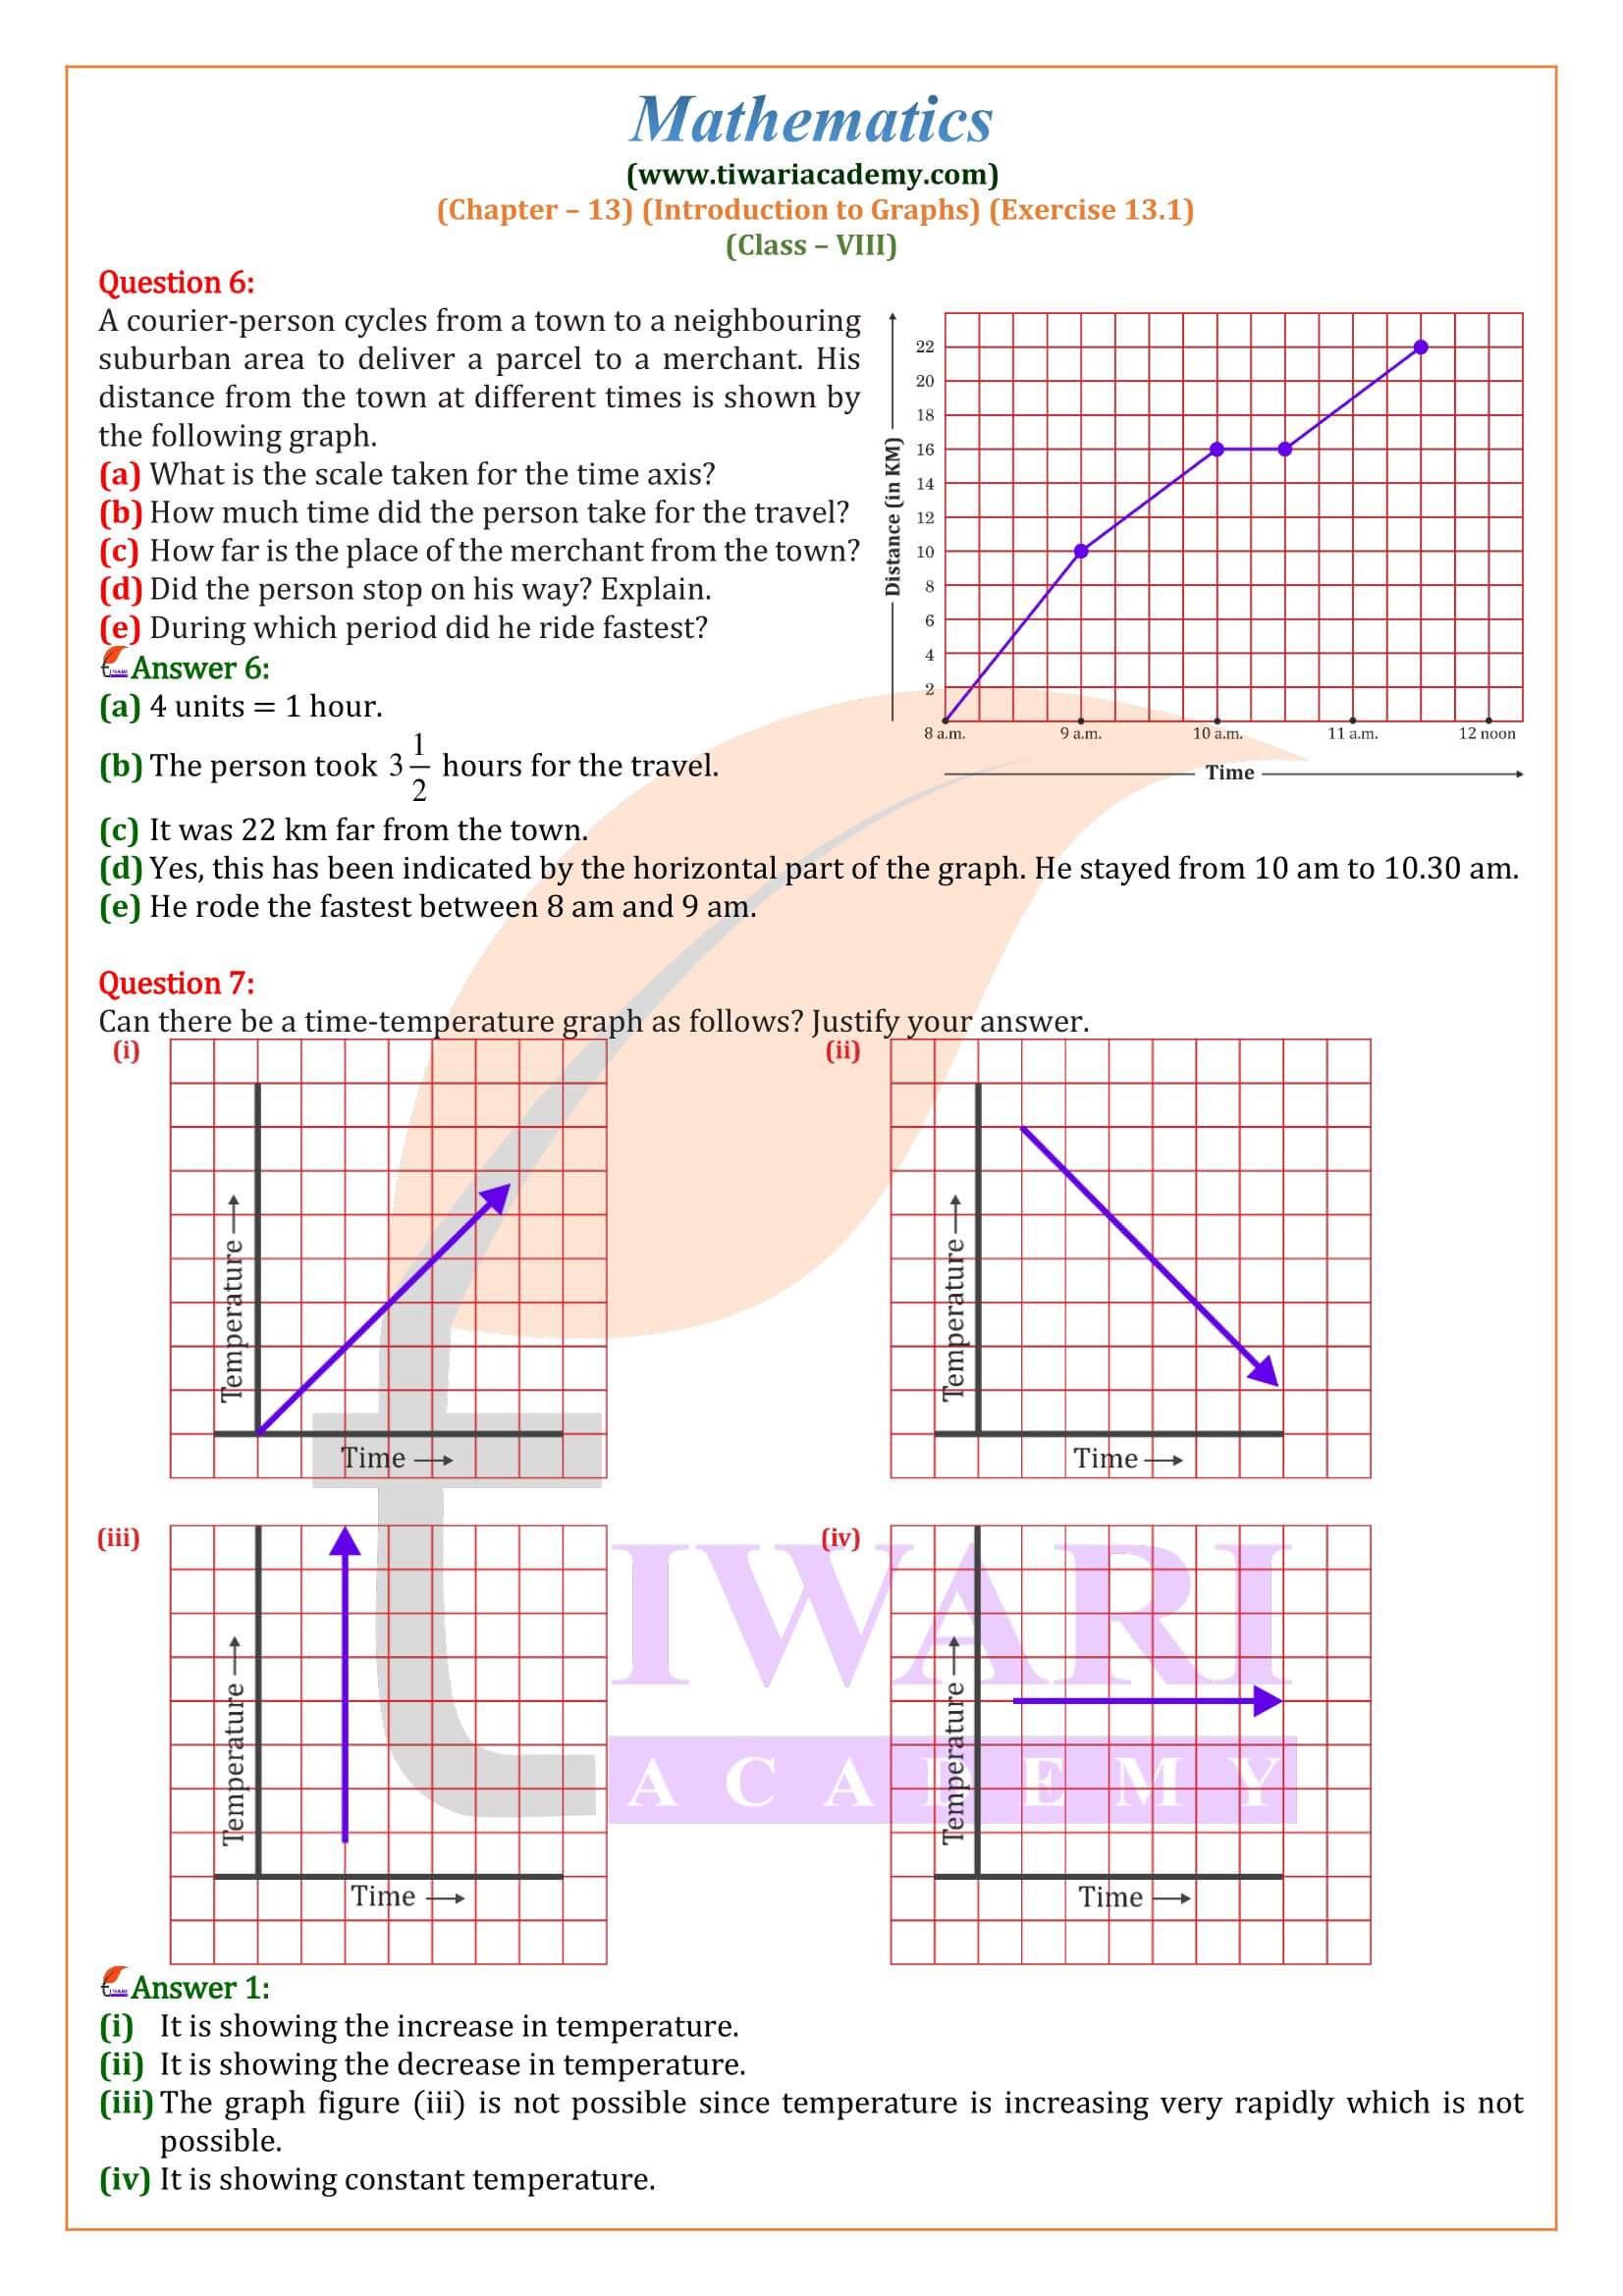
Class VIII Mathematics NCERT Ex. 13.1 Introduction to Graphs in Hindi and English Medium updated for CBSE session 2026-27. All the contents are updated according to latest CBSE curriculum for 2026-27. Class 8 mathematics exercise 13.1 contains the questions based on observation of linear graphs as well as drawing of linear graphs using given conditions. Students can get the step by step solutions from class 8 Maths exercise 13.1 explanation video.
CBSE NCERT App for Class 8


Coordinate Axes
On a graph paper draw two mutually perpendicular straight lines X’ OX’ and YOY’, intersecting each other at the point O.
These lines are known as coordinate axes. The line X’ OX’ is called the x-axis and the line YOY’ is called the y-axis, while the point O is called the origin.
Cartesian plane
The plane of the paper containing both the coordinate axes is called the Cartesian plane. On right-hand side of the y-axis, every end-point of a square on x-axis, represents a positive integer.
Above the x-axis, every end-point of a square on the y-axis, represents a positive integer.
Ordered pair
A pair of two number a and b, listed in a specific order, is called an ordered pair (a, b) with a at the first place and b at the second place. Note that (a, b) ≠ (b, a). Thus (4, 3) ≠ (3, 4).
Coordinates of a Point
On a graph paper, let X’OX and YOY’ be the coordinate axes. Let p be a point on the graph paper such that p is at distance of a units from the y-axis and b units from the x-axis. Then, we say that the coordinates of p are p (a, b). Here a is called the x-coordinate or abscissa of p, while b is called the y-coordinate or ordinate of p.
Quadrants
The coordinate axes divide the plane of the graph paper into four regions, called quadrants.
| Region | Quadrant | Signs of coordinates |
|---|---|---|
| XOY | I | (+, +) |
| YOX’ | II | (-, +) |
| X’OY’ | III | (-, -) |
| Y’OX | IV | (+, -) |
Plot each of the following points on a graph paper: (i) A (5, 2) (ii) B (-2, 4) (iii) C (-4, – 6) (iv) D (4, – 3)
Let X’ OX and YOY’ be the coordinate axes,
(i) On the x-axis, take 5 units to the right of the y-axis and then on the y-axis. take 2 units above the x-axis. Thus, we get the point A (5, 2).
(ii) On the x-axis, take 2 units to the left of the y-axis and then on the y-axis, take 4 units above the x-axis. Thus, we get the point B (-2, 4).
(iii) On the x-axis, take 4 units to the right of the y-axis and then on the y-axis, take 6 units below the x-axis. Thus, we get the point C (-4, – 6).
(iv) On the x-axis take 4 units to the right of the y-axis and then on the y-axis, take 3 units below the x-axis. Thus, we get the point D (4, – 3).
Graph of Perimeter Versus Length of the Side of a Square
For a square we have, perimeter = (4 x side of the square).
(a) Consider the relation between the perimeter and the side of a square, given by P = 4a. Draw a graph of the above function. side of the square
(b) From the graph, find the value of p, when (i) a = 5 (ii) a = 6
The given function is p = 4a. For different values of a, the corresponding values of p
On a graph paper, plot the points O (0, 0), A (1. 4), B (2, 8), C (3, 12) and D (4, 16). Join these points to get the required graph line.
(i) On the x-axis, take the point L at a = 5. 3
Draw LE x-axis, meeting the graph at E.
Clearly, EL = 20 units. So, a = 5 Þ P = 20.
Thus, when a = 5, then P = 20.
(ii) On the x-axis, take the point M at a = 6.
Draw MF Ʇ x-axis, meeting the graph at F.
Clearly, MG = 24 units
So, a = 6, or, P = 24.
Thus, when a = 6, then p = 24.
Graph of Area Versus Side of Side of a Square
We know that area of a square = (side)²
Thus, A = x².
(a) Consider the relation between the area and the side of a square, given by A = x². Draw a graph of the above the above function.
(b) From the graph, find the value of A, when x = 4.
The given function is A = x².
For different values of x-we get the corresponding value of A.
For x = 0, A = 02 = 0
x = 1, A = 12 = 1
x = 2, A = 2² = 4 and so on.
Thus, we have the points O (0, 0), B (1, 1), C (2, 4) and D (3, 9). Plot these points on a graph paper and join them successively to obtain the required graph.
Reading off from the graph
On the x-axis, take the point L at x = 4.
Draw LP x-axis, meeting the given graph at p.
Clearly, PL = 16 units.
So, x = 4, the, A = 16.
Thus, when x = 4 units, A = 16 sq units.
How can graphs be used in real life?
Graphs can be used in real life in many ways. For example: a line graph in the form of a straight line signifies a linear relationship between two quantities represented on x-axis and y axis. A circle graph may show the percentage expenditure incurred on different household items during a month.
What information can we get from graphs?
Graphs are a great way to take a great deal of numerically-based information, like from a scientific study, and condense it into a more easily readable format. Graphs allow people to interpret the results of a study and even make predictions about trends they might see in future data sets.
What parts of a graph are negative?
The negative regions of a function are those intervals where the function is below the x-axis. It is where the y-values are negative (not zero). y-values that are on the x-axis are neither positive nor negative. The x-axis is where y = 0.