by Tiwari Academy Team
NCERT Solutions for Class 9 Maths Exercise 14.2 Statistics in Hindi and English Medium updated for this session. Find the latest Class 9 Maths Exercise 14.2 solutions for Statistics at Tiwari Academy, available in Hindi and English for both CBSE and State Boards.
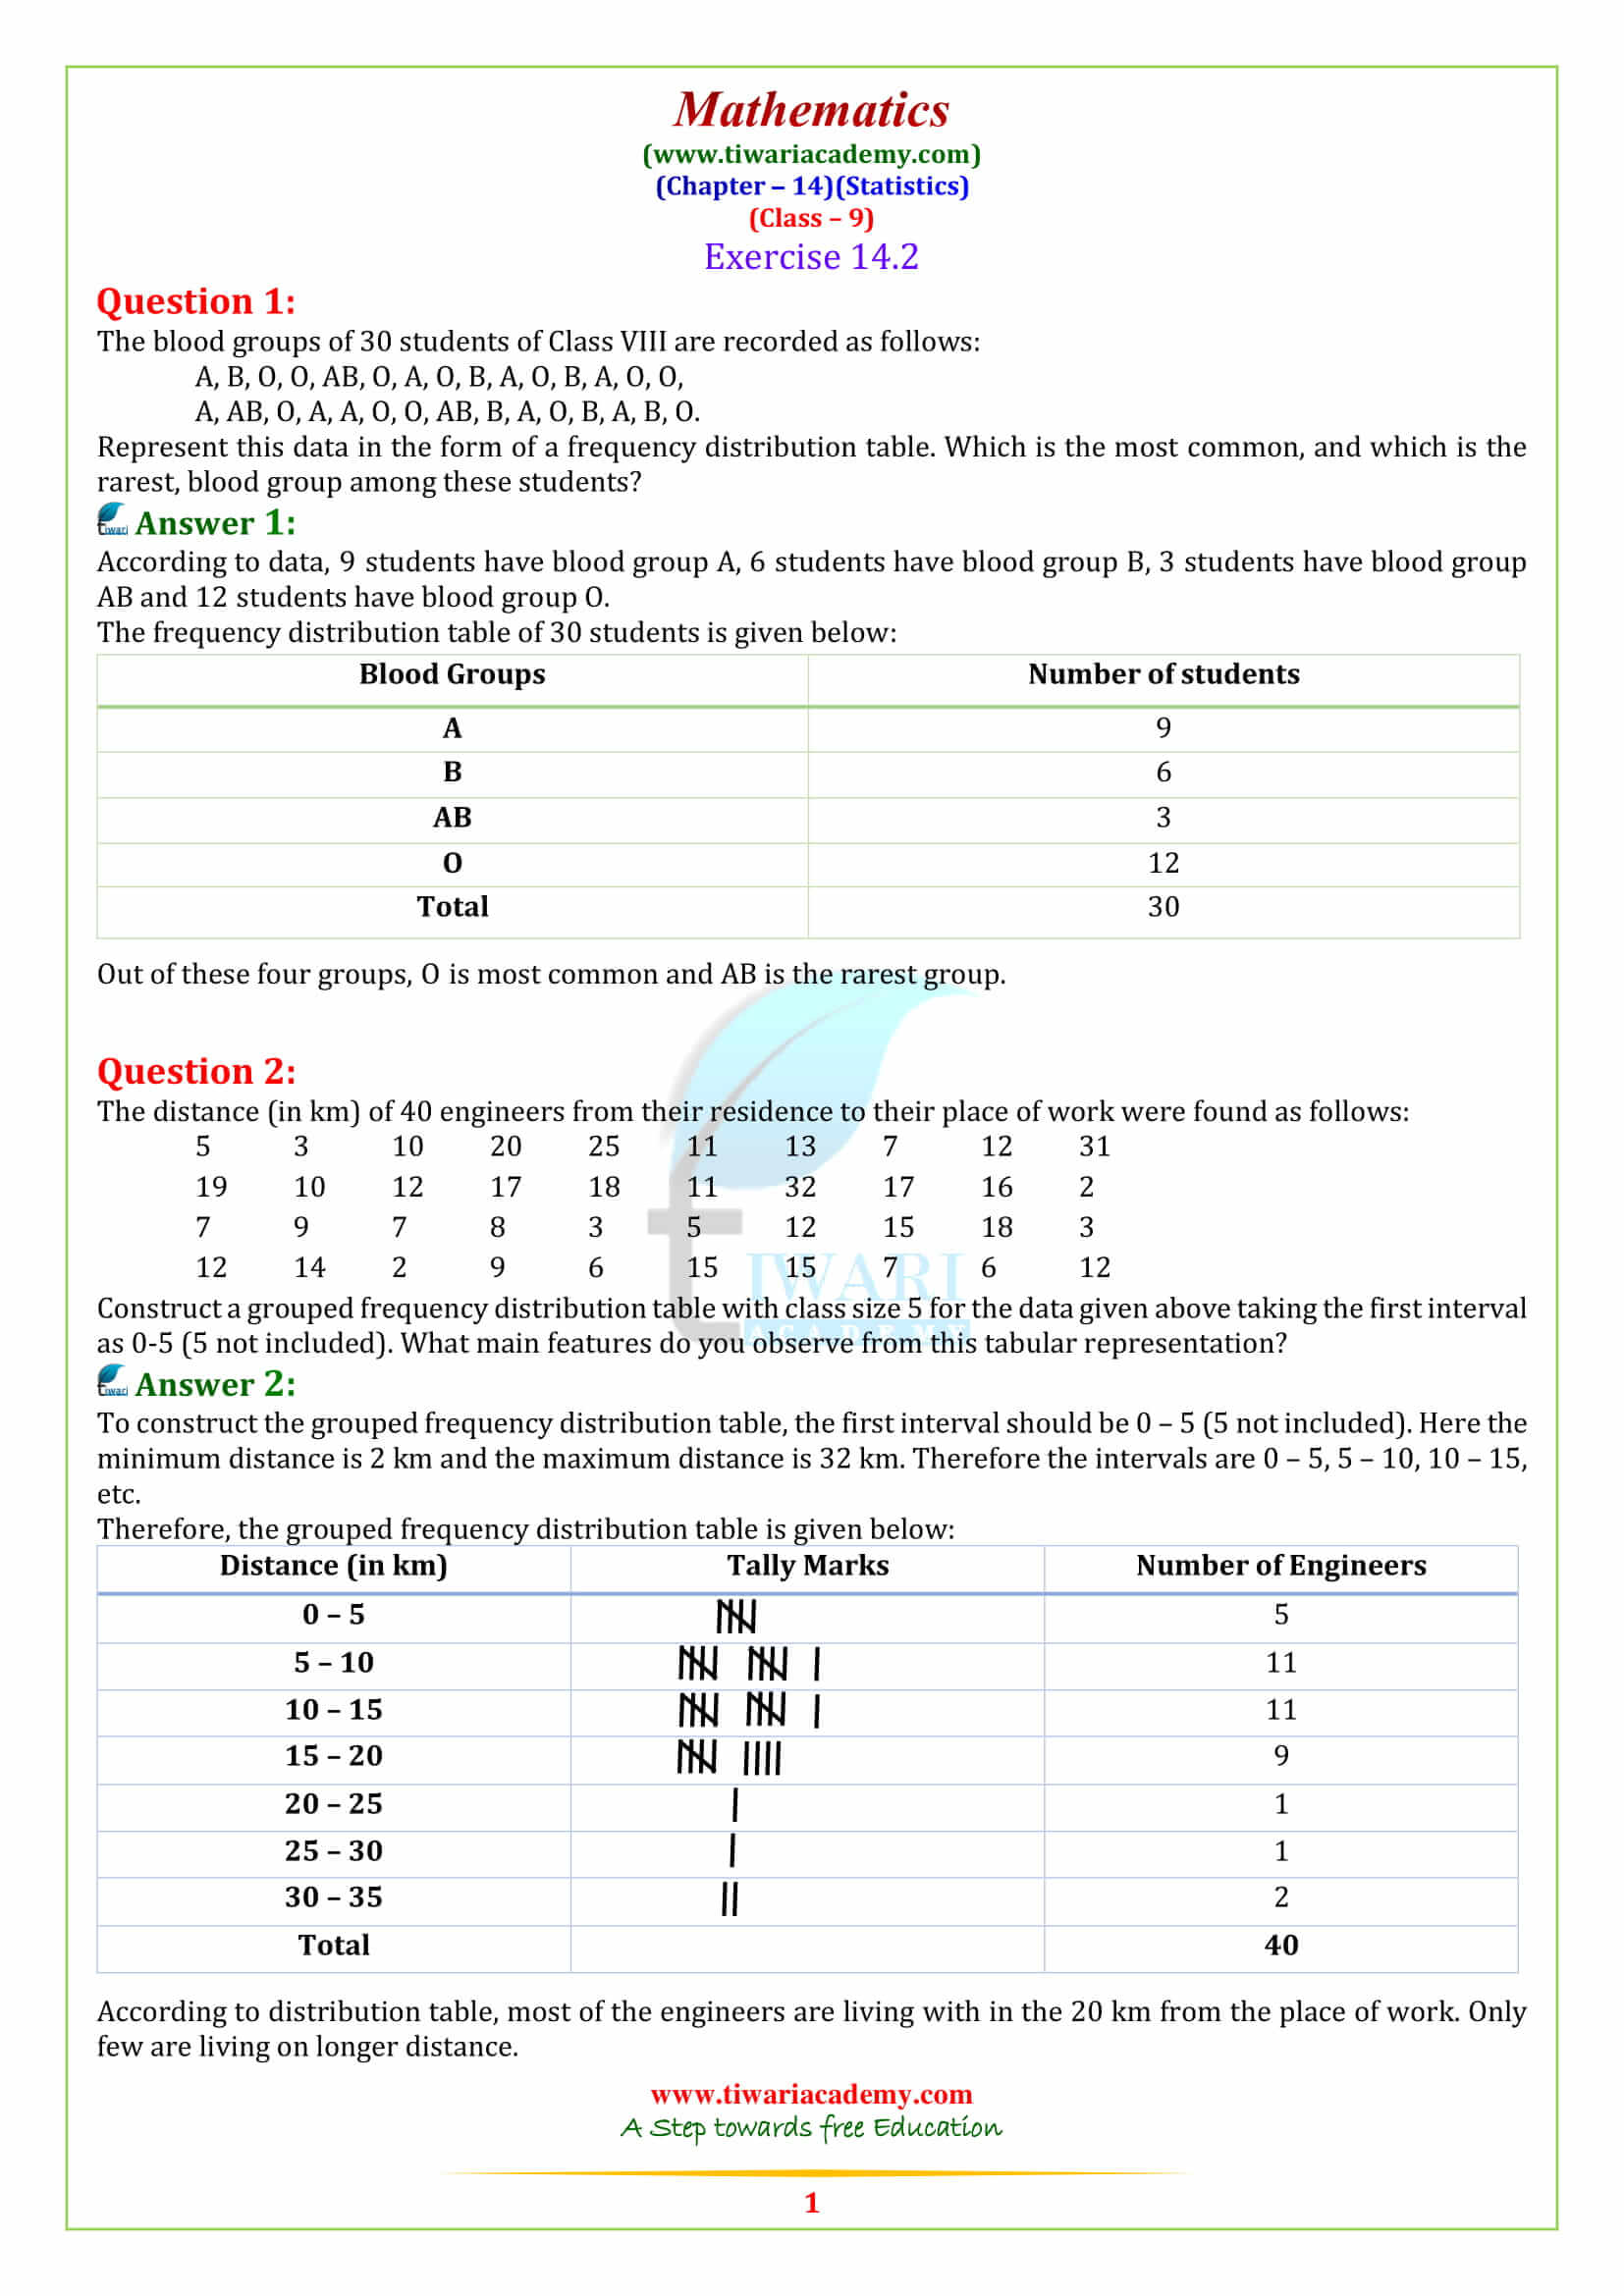
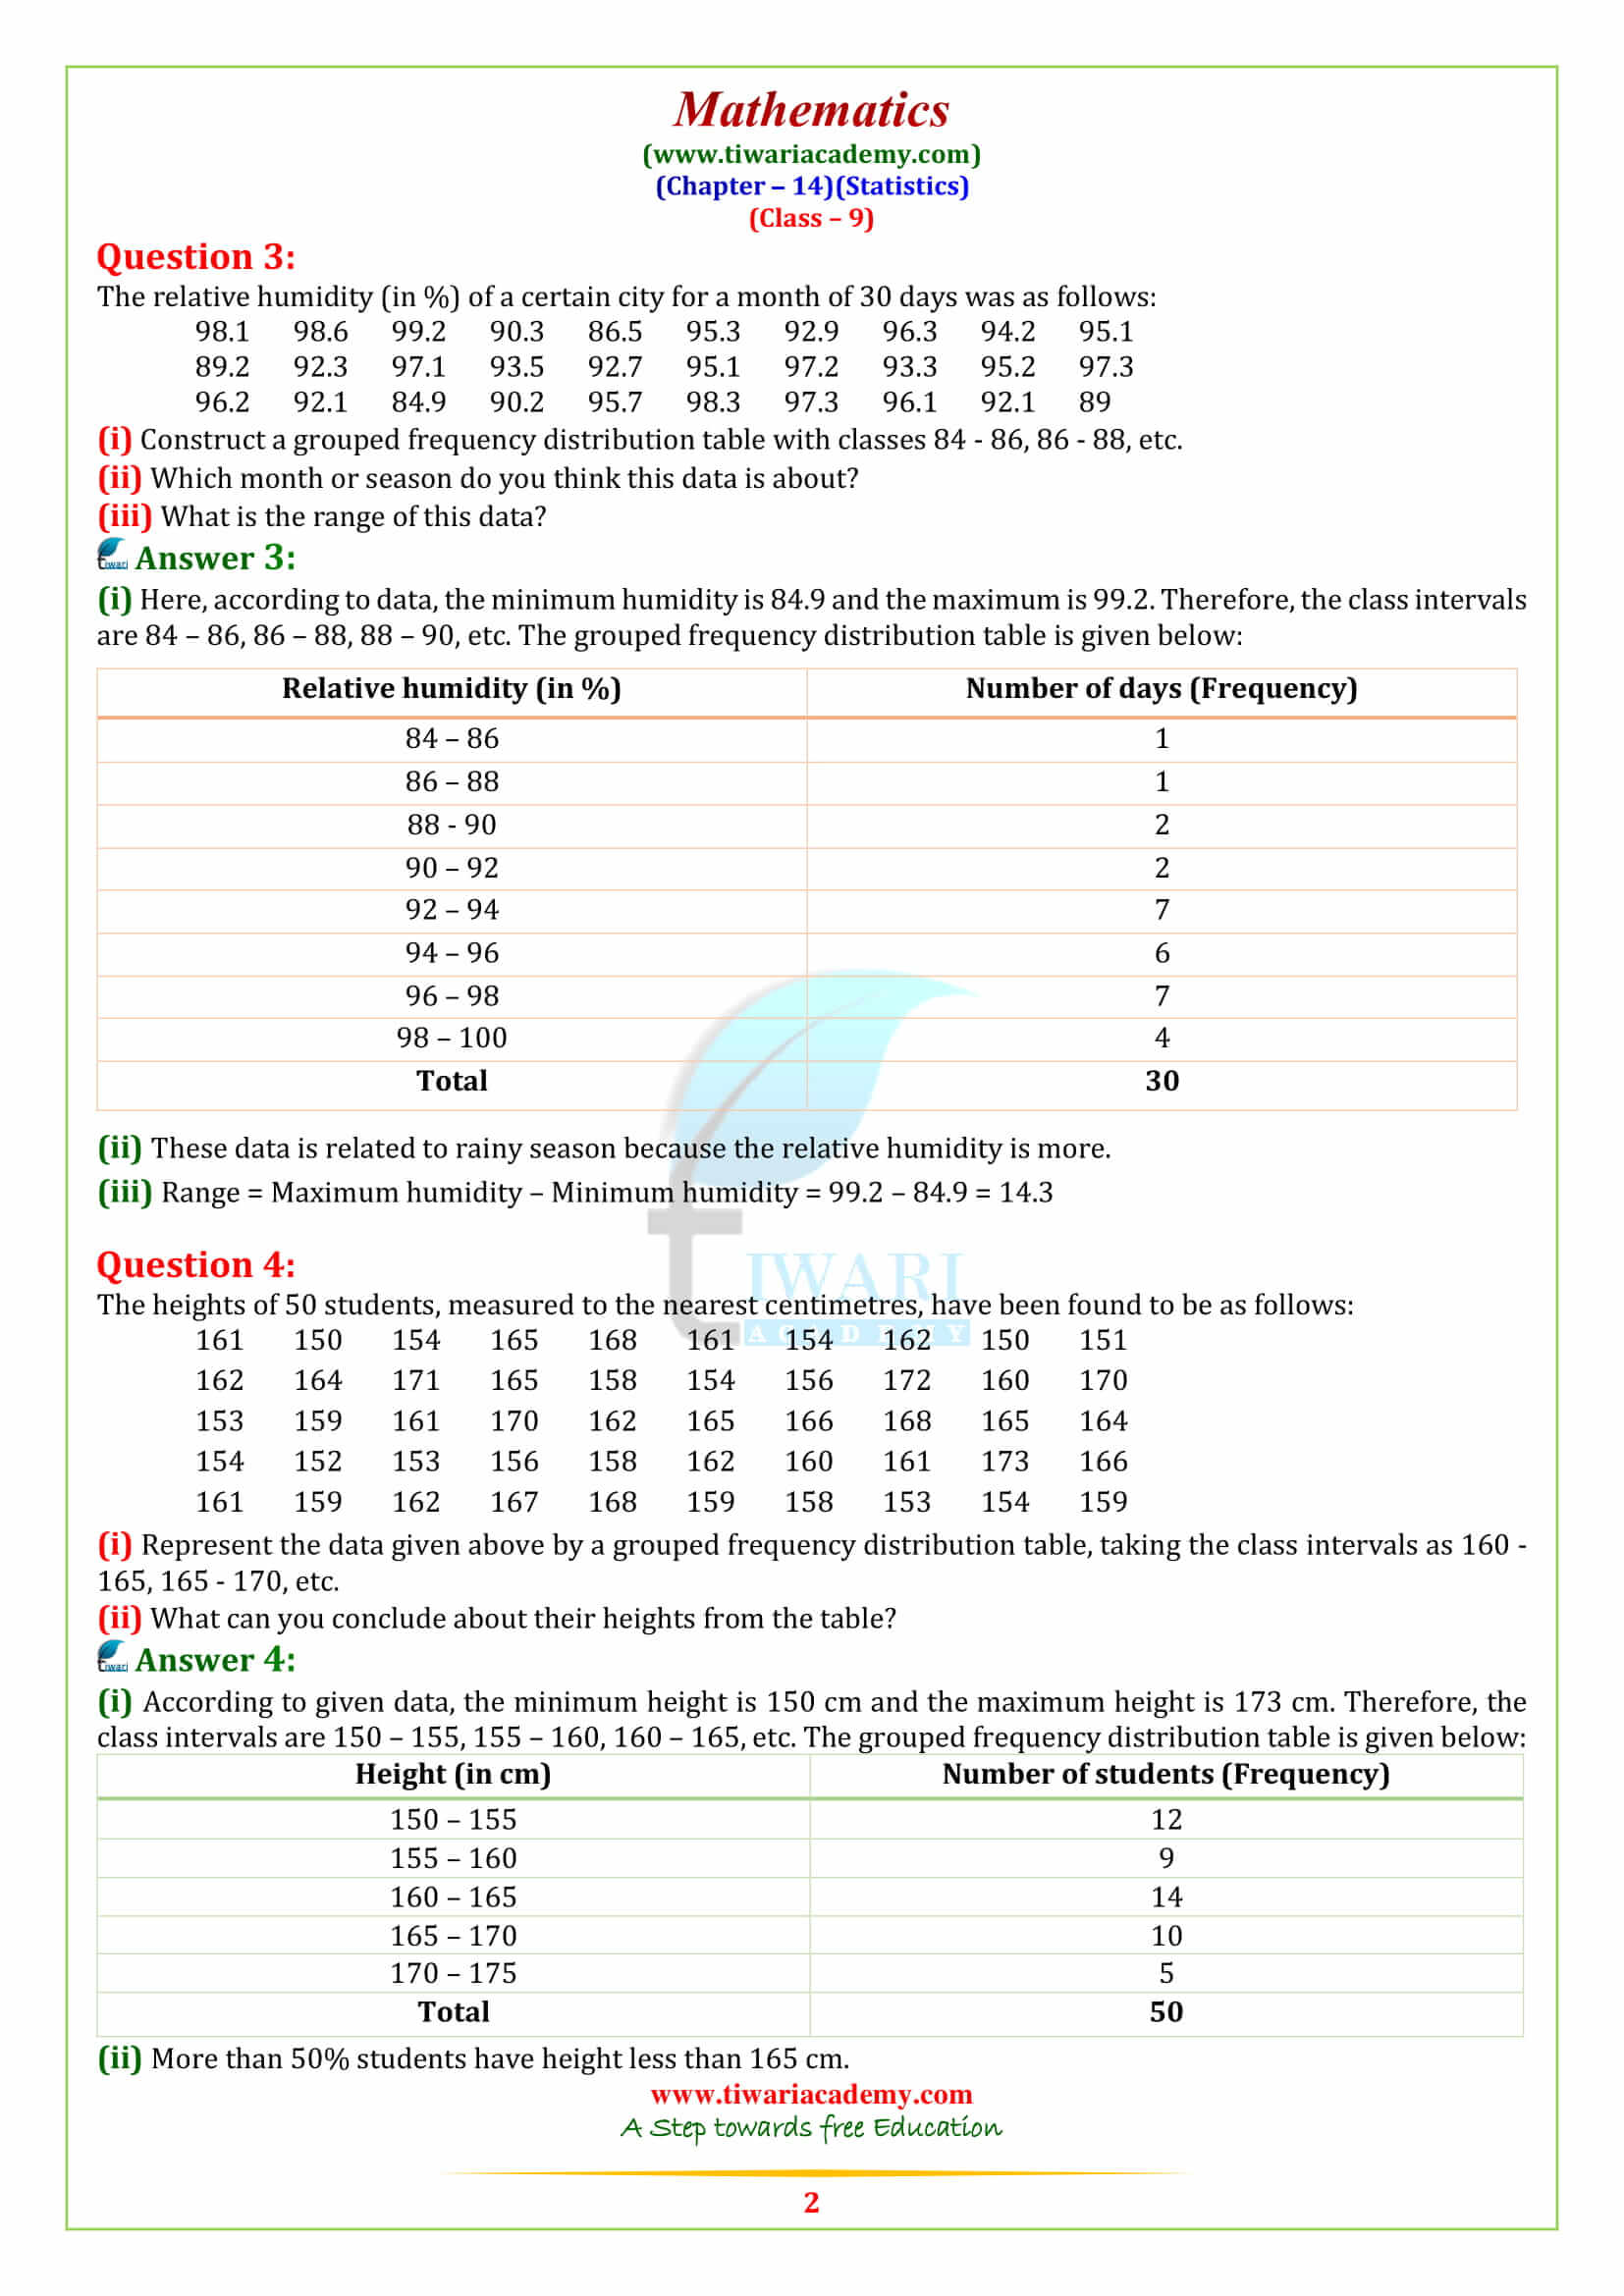
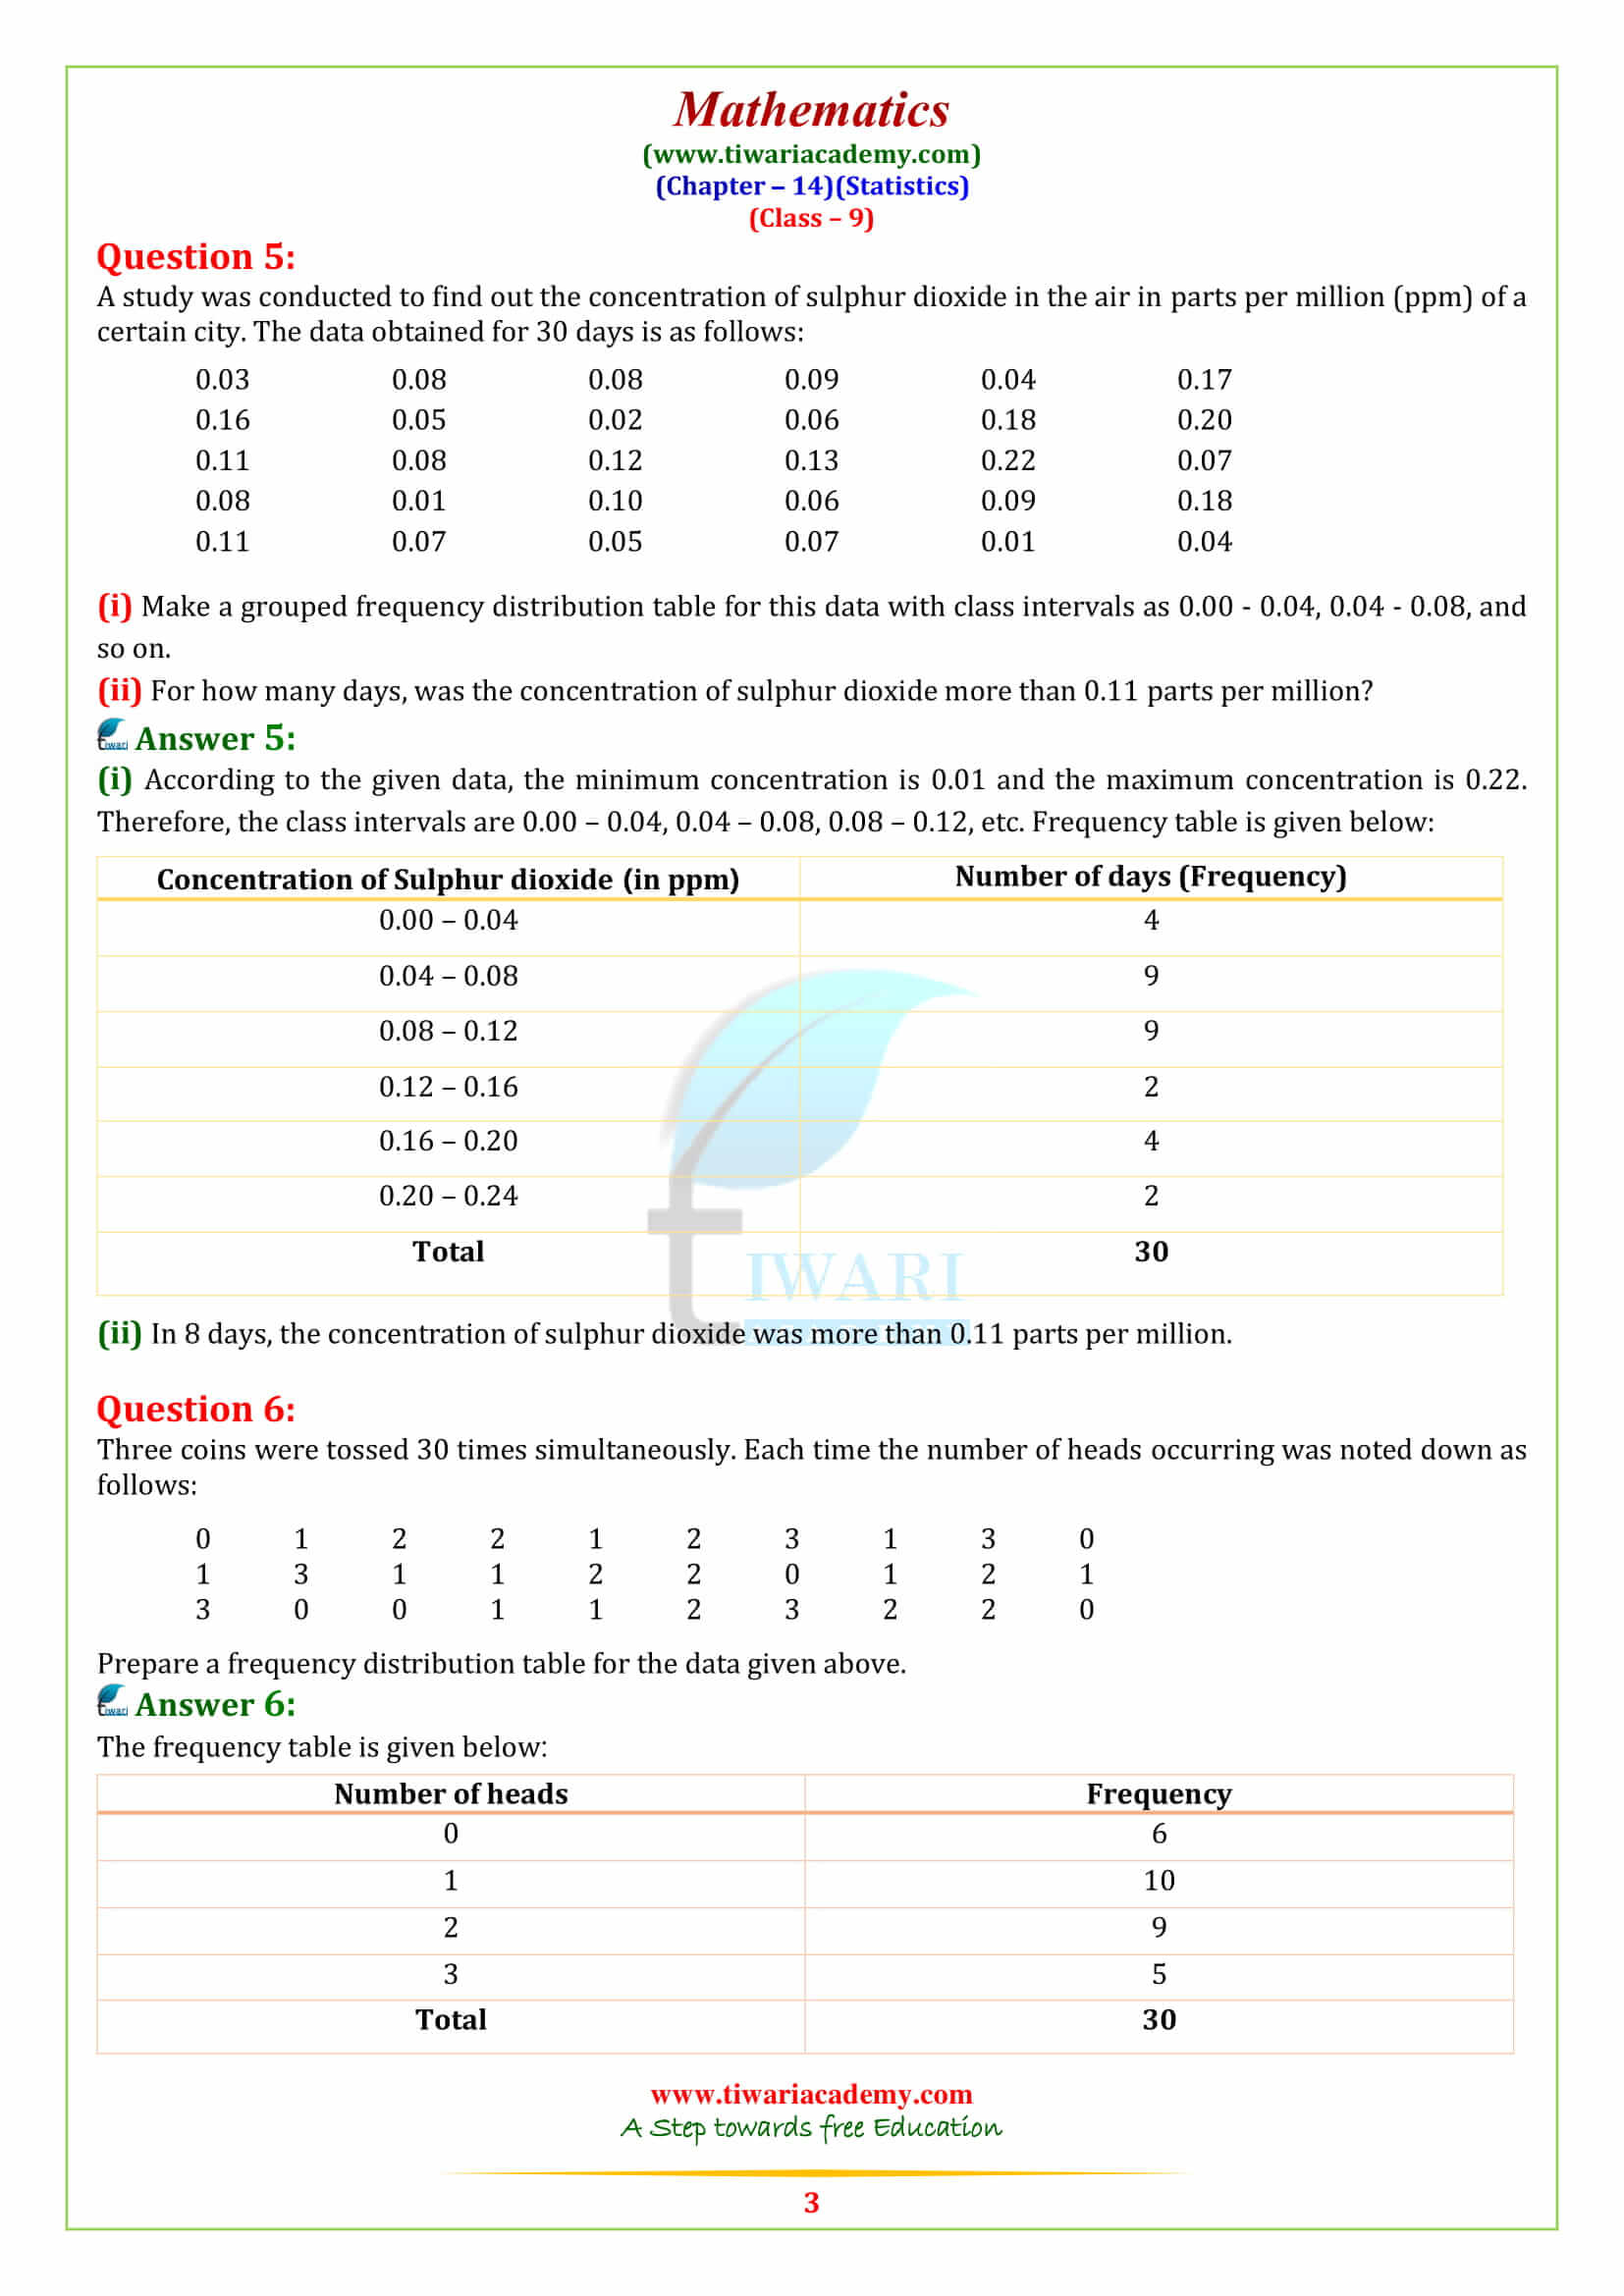
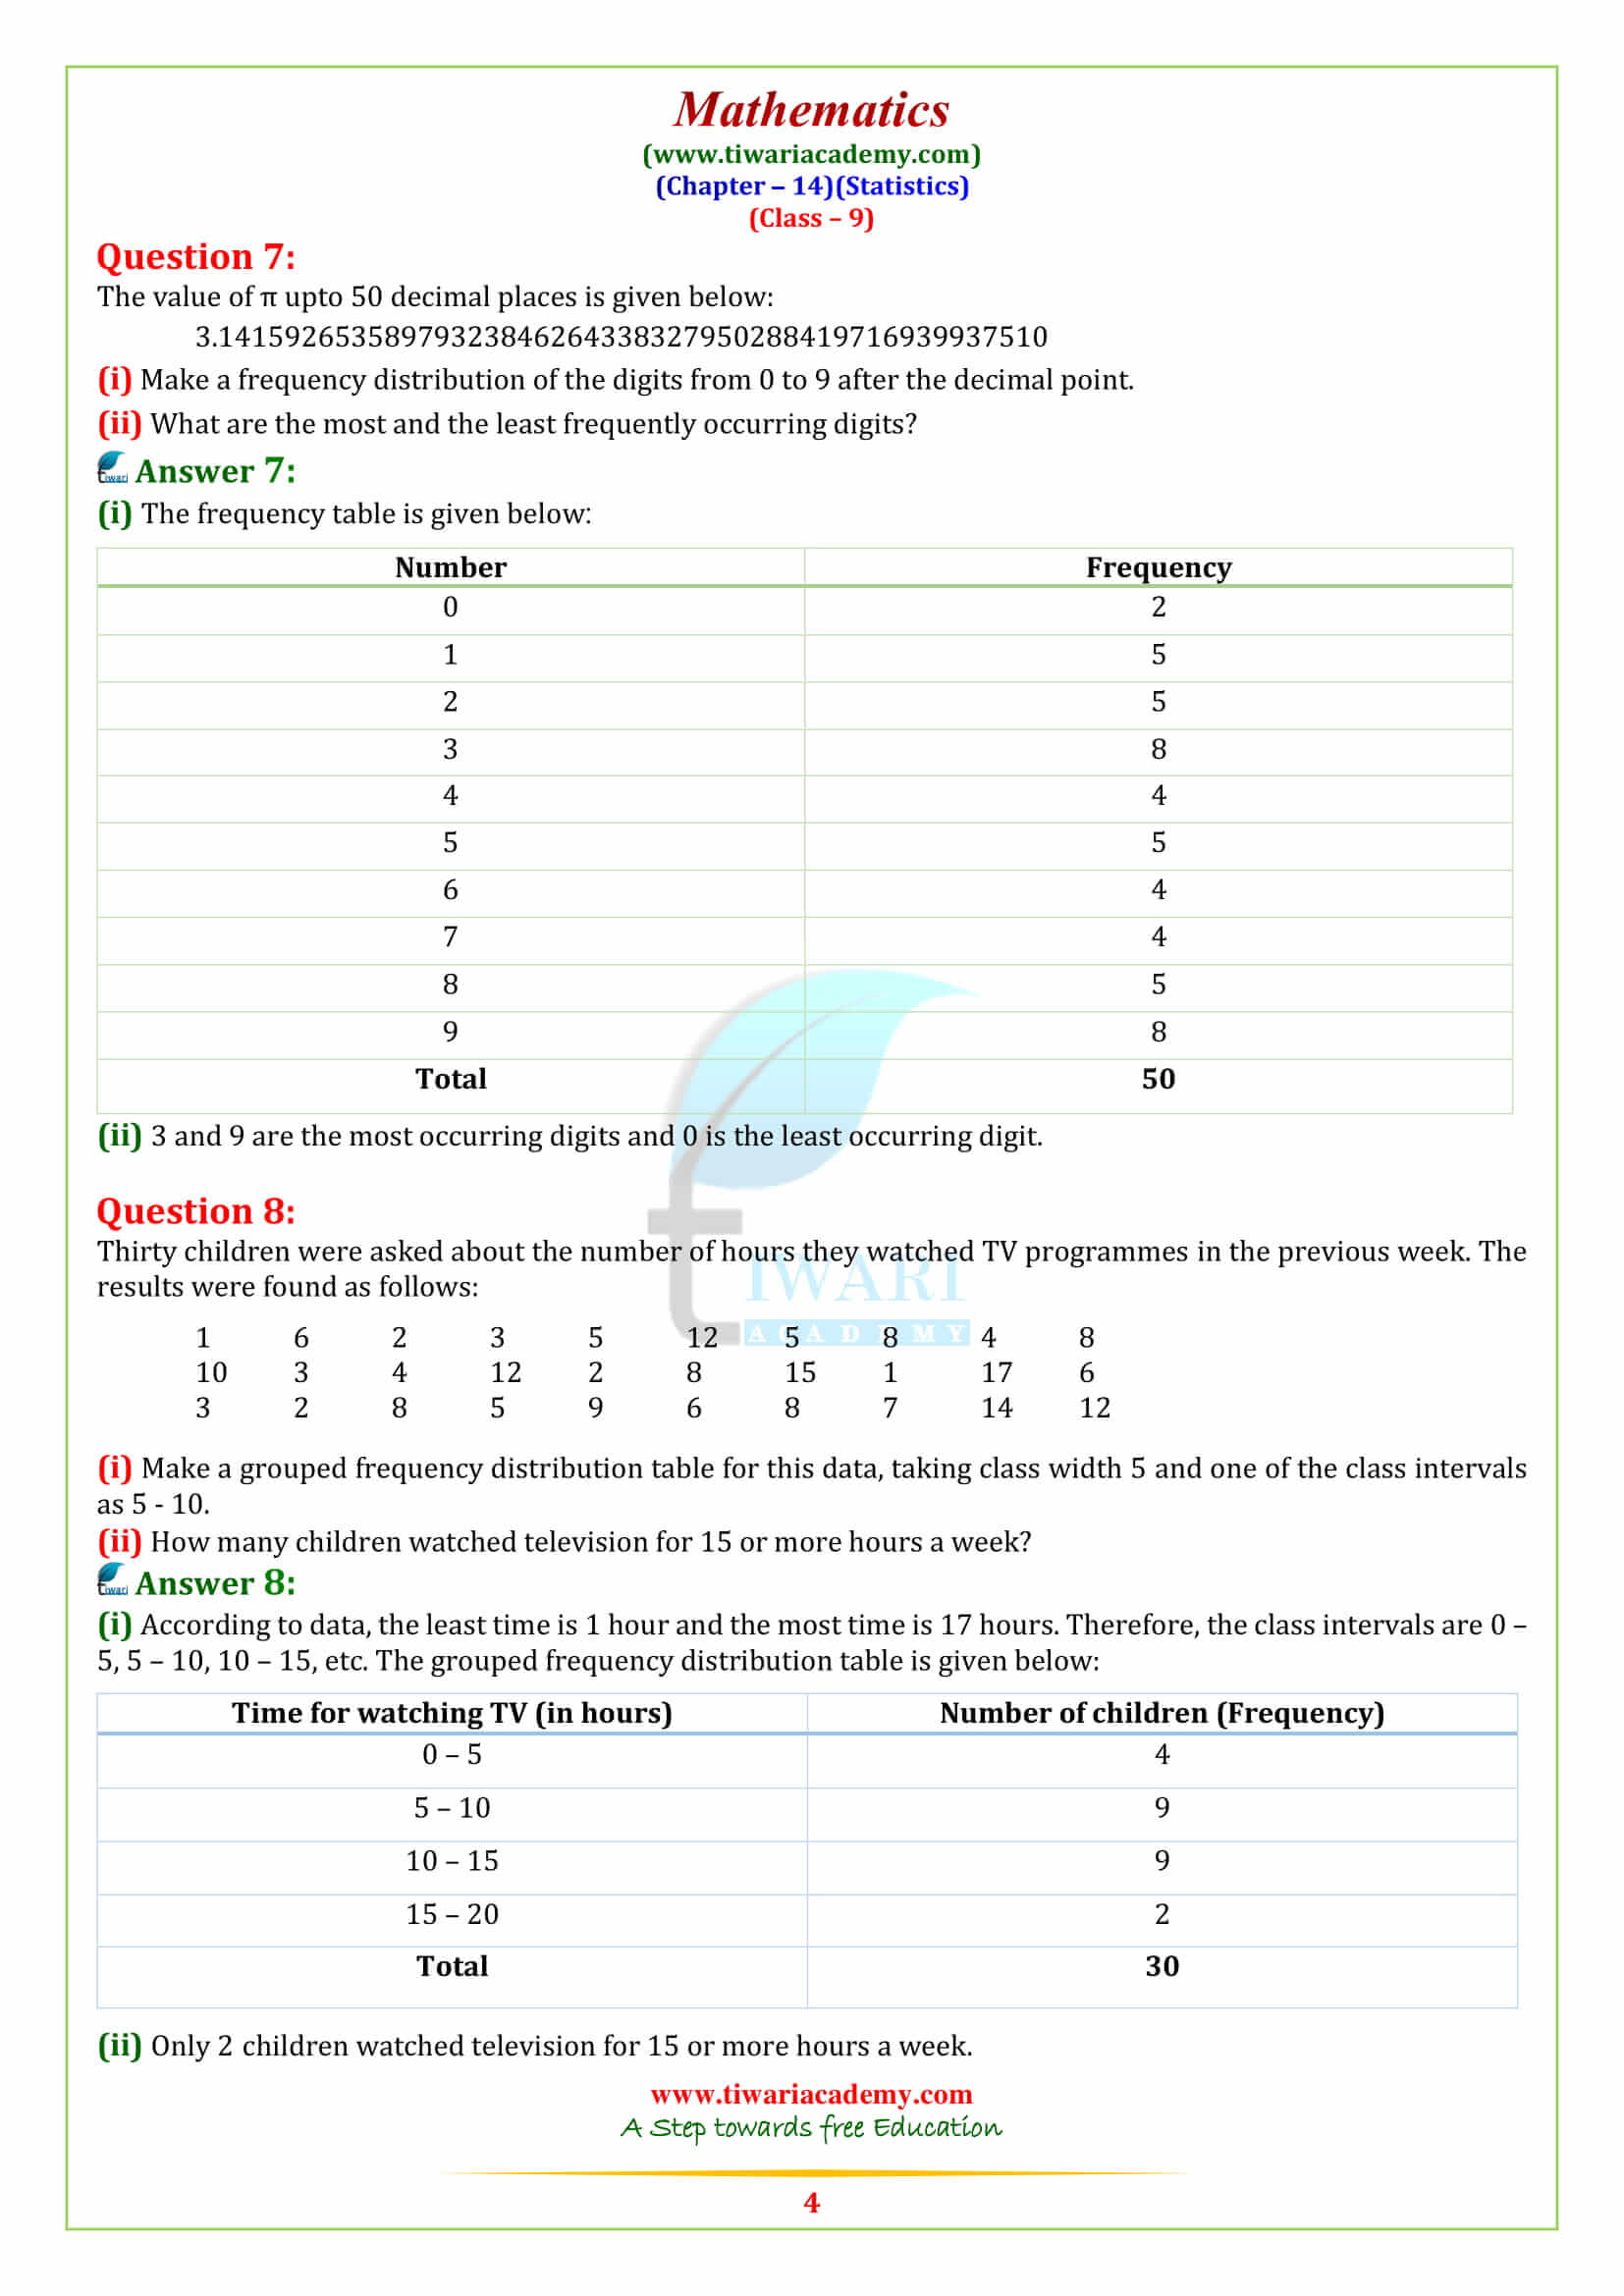
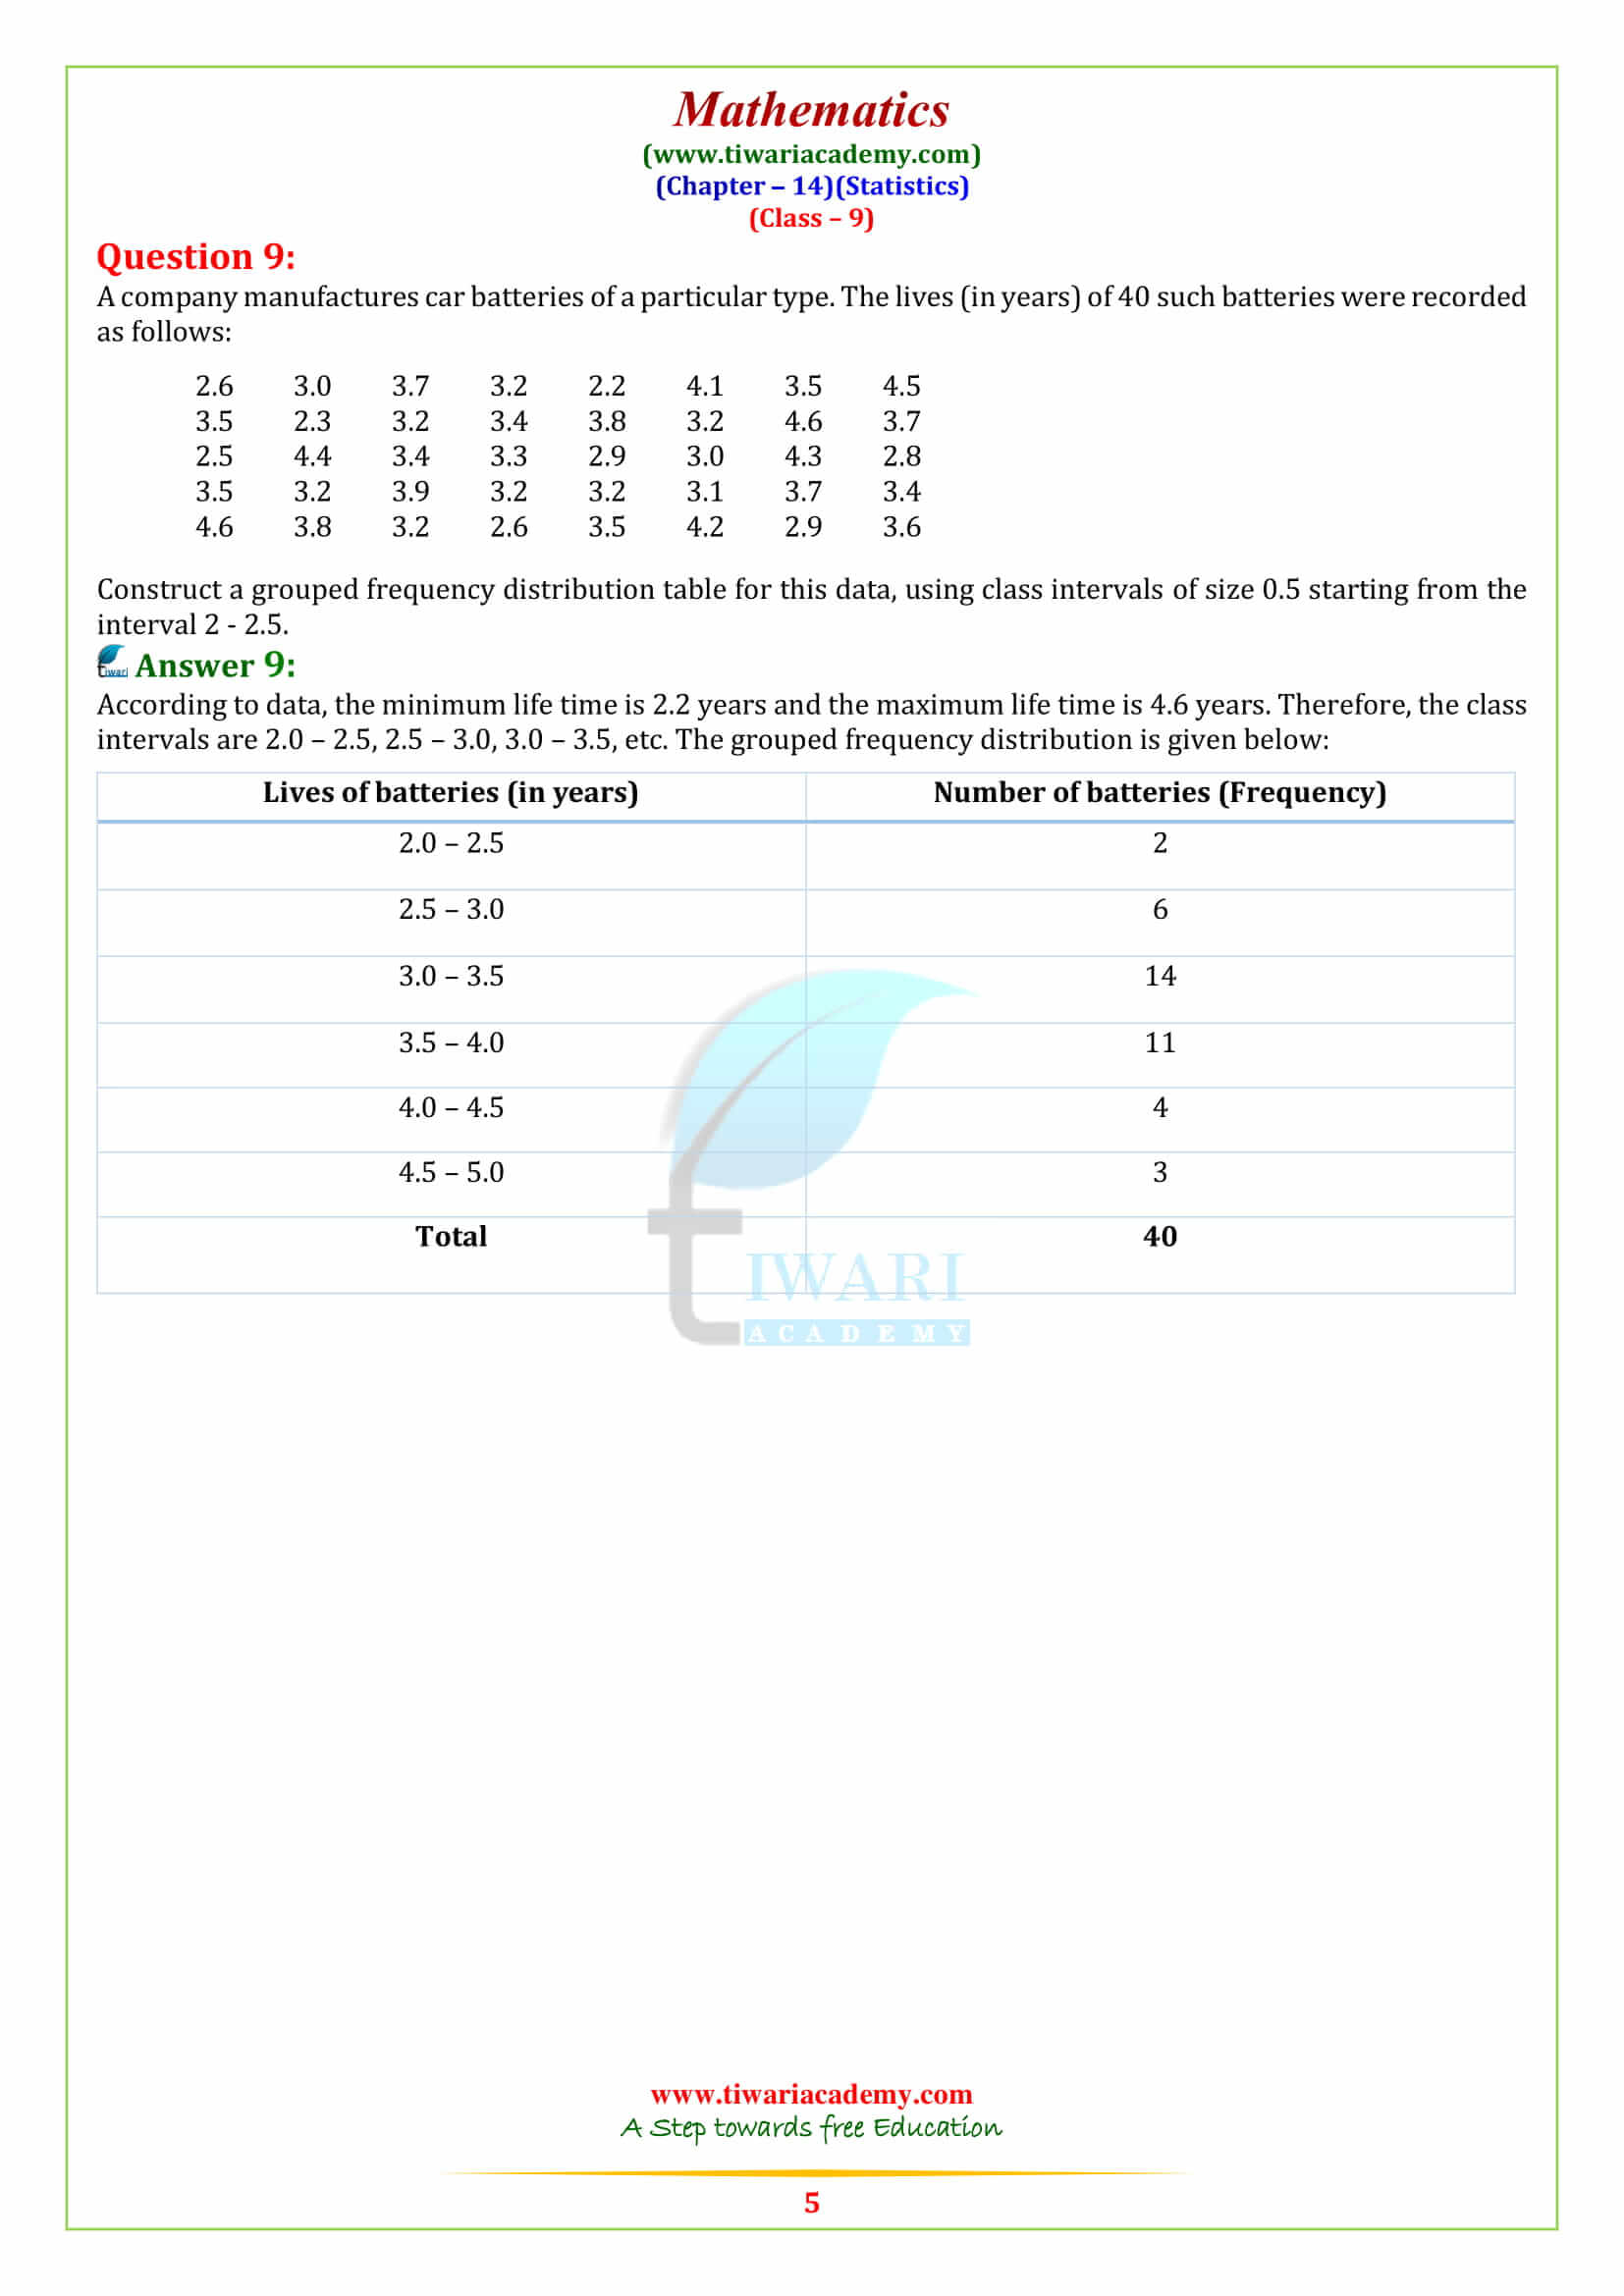
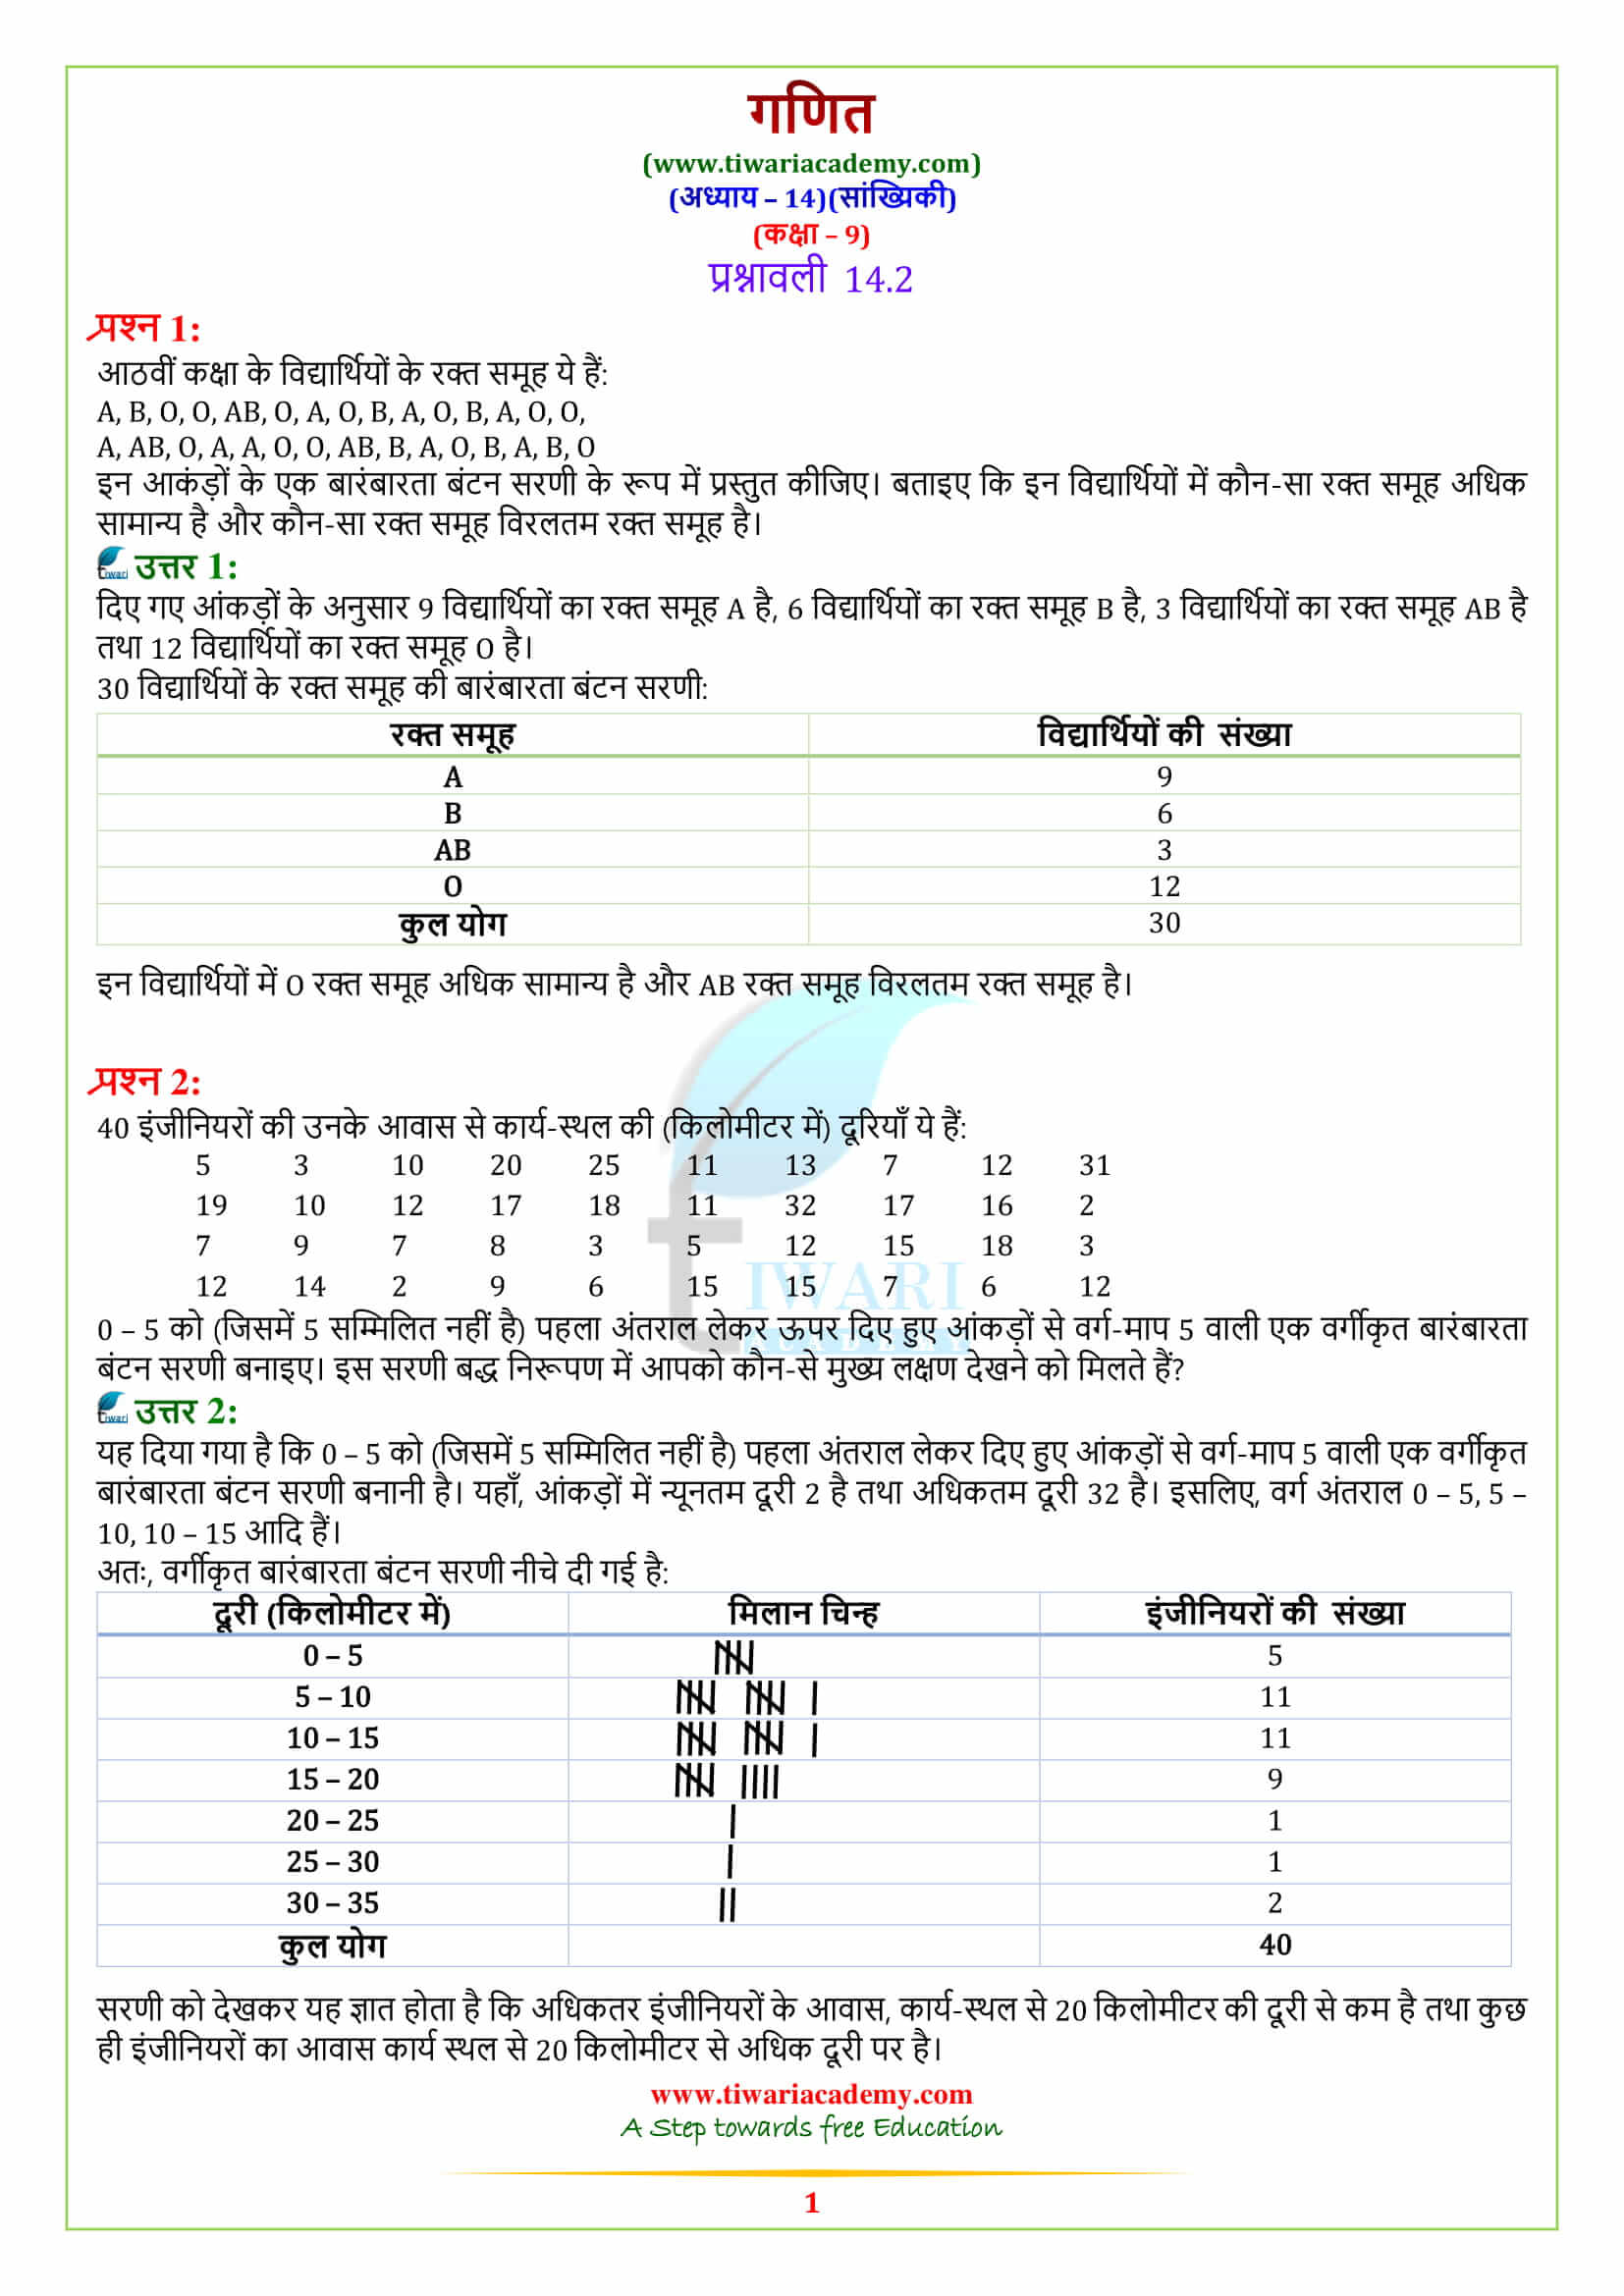
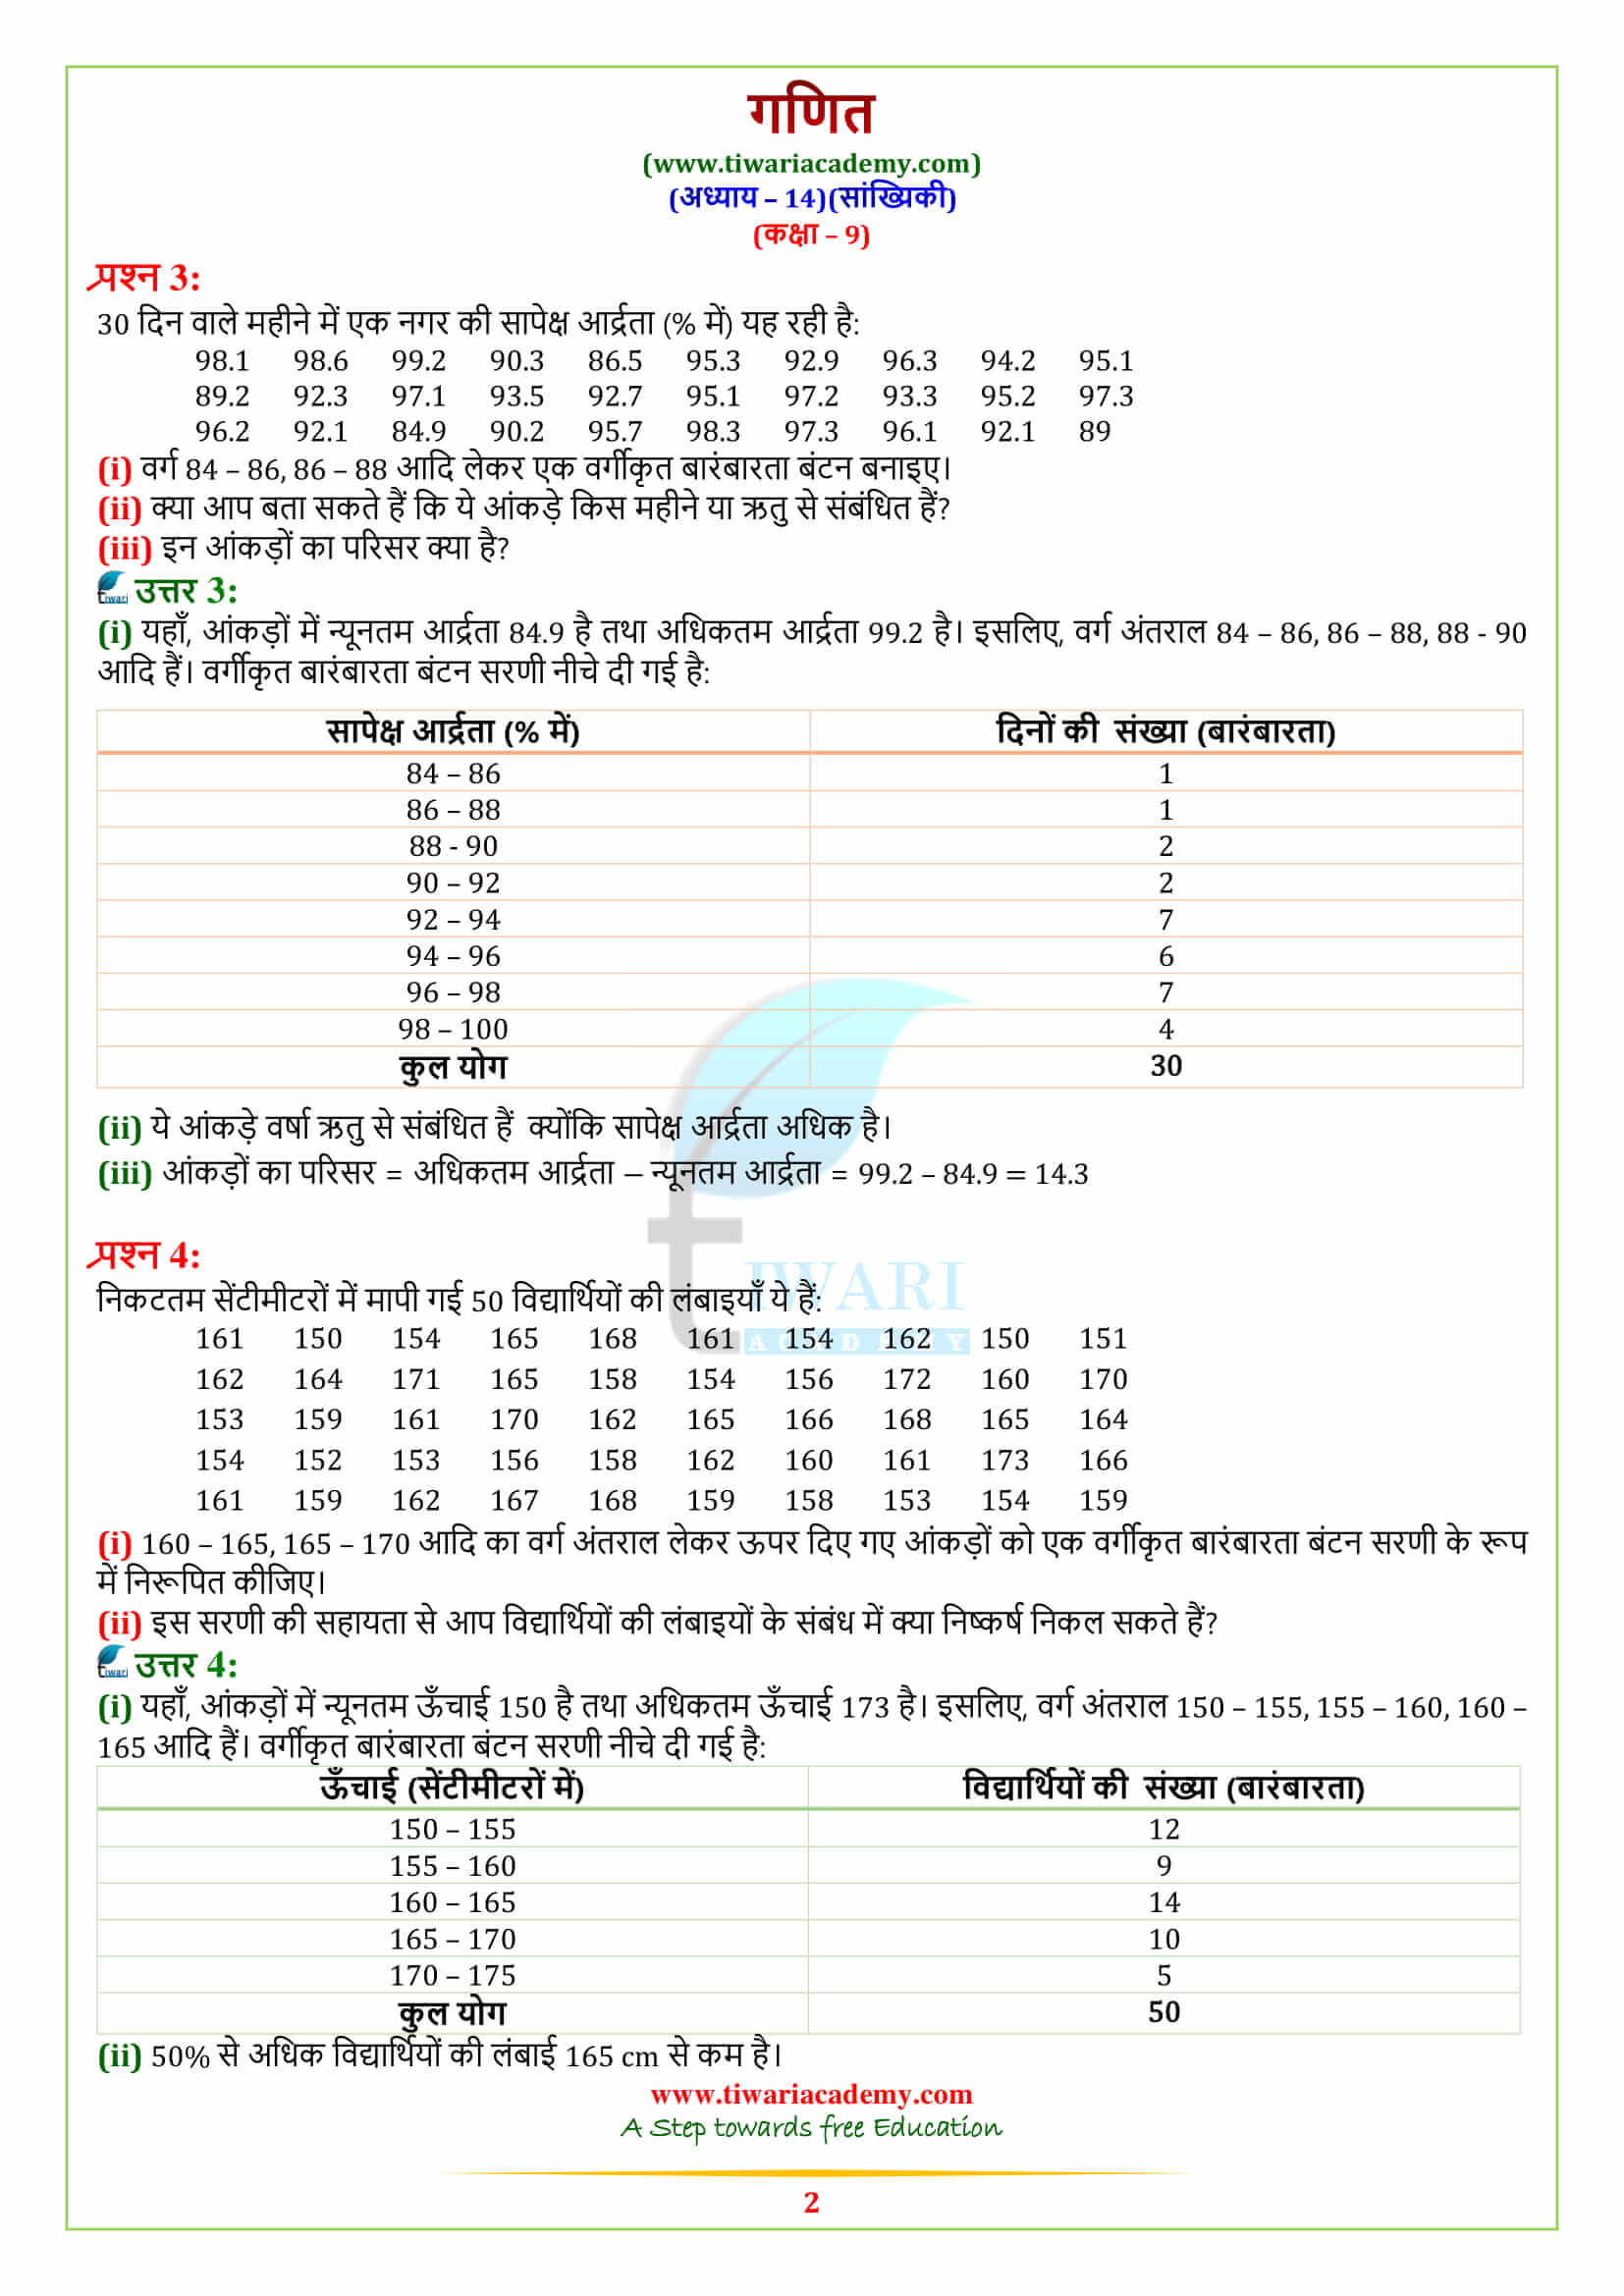
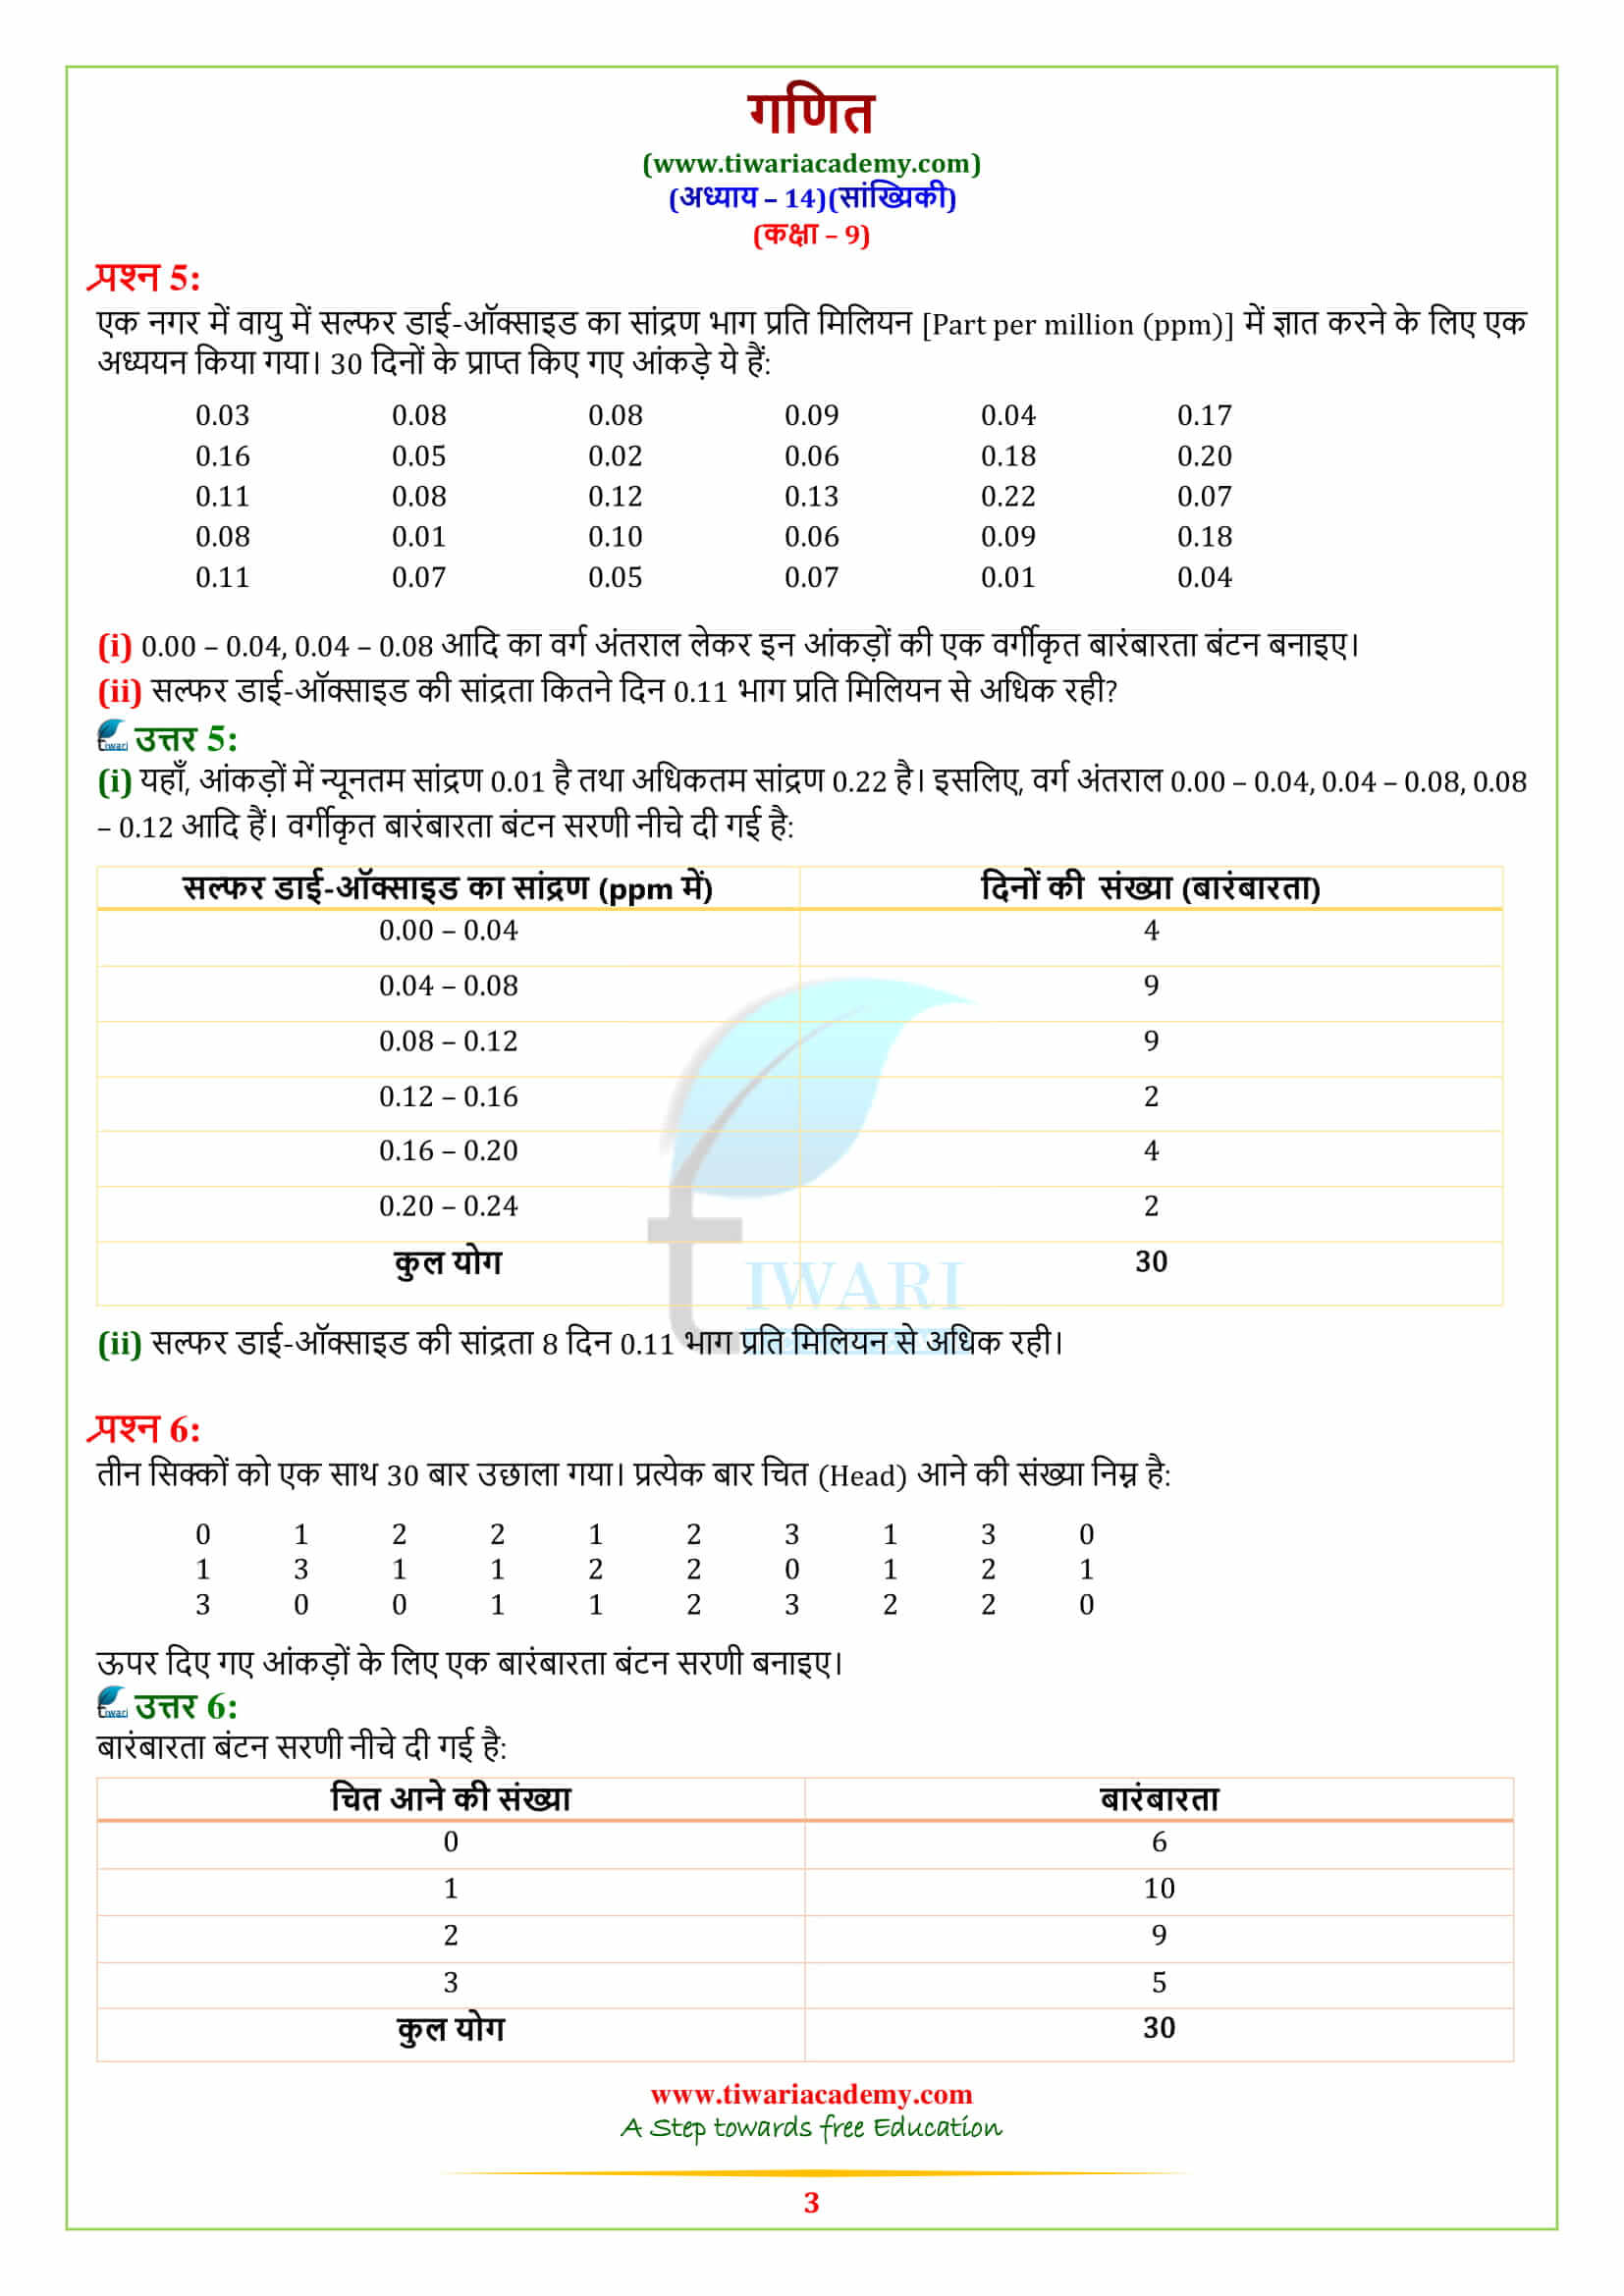
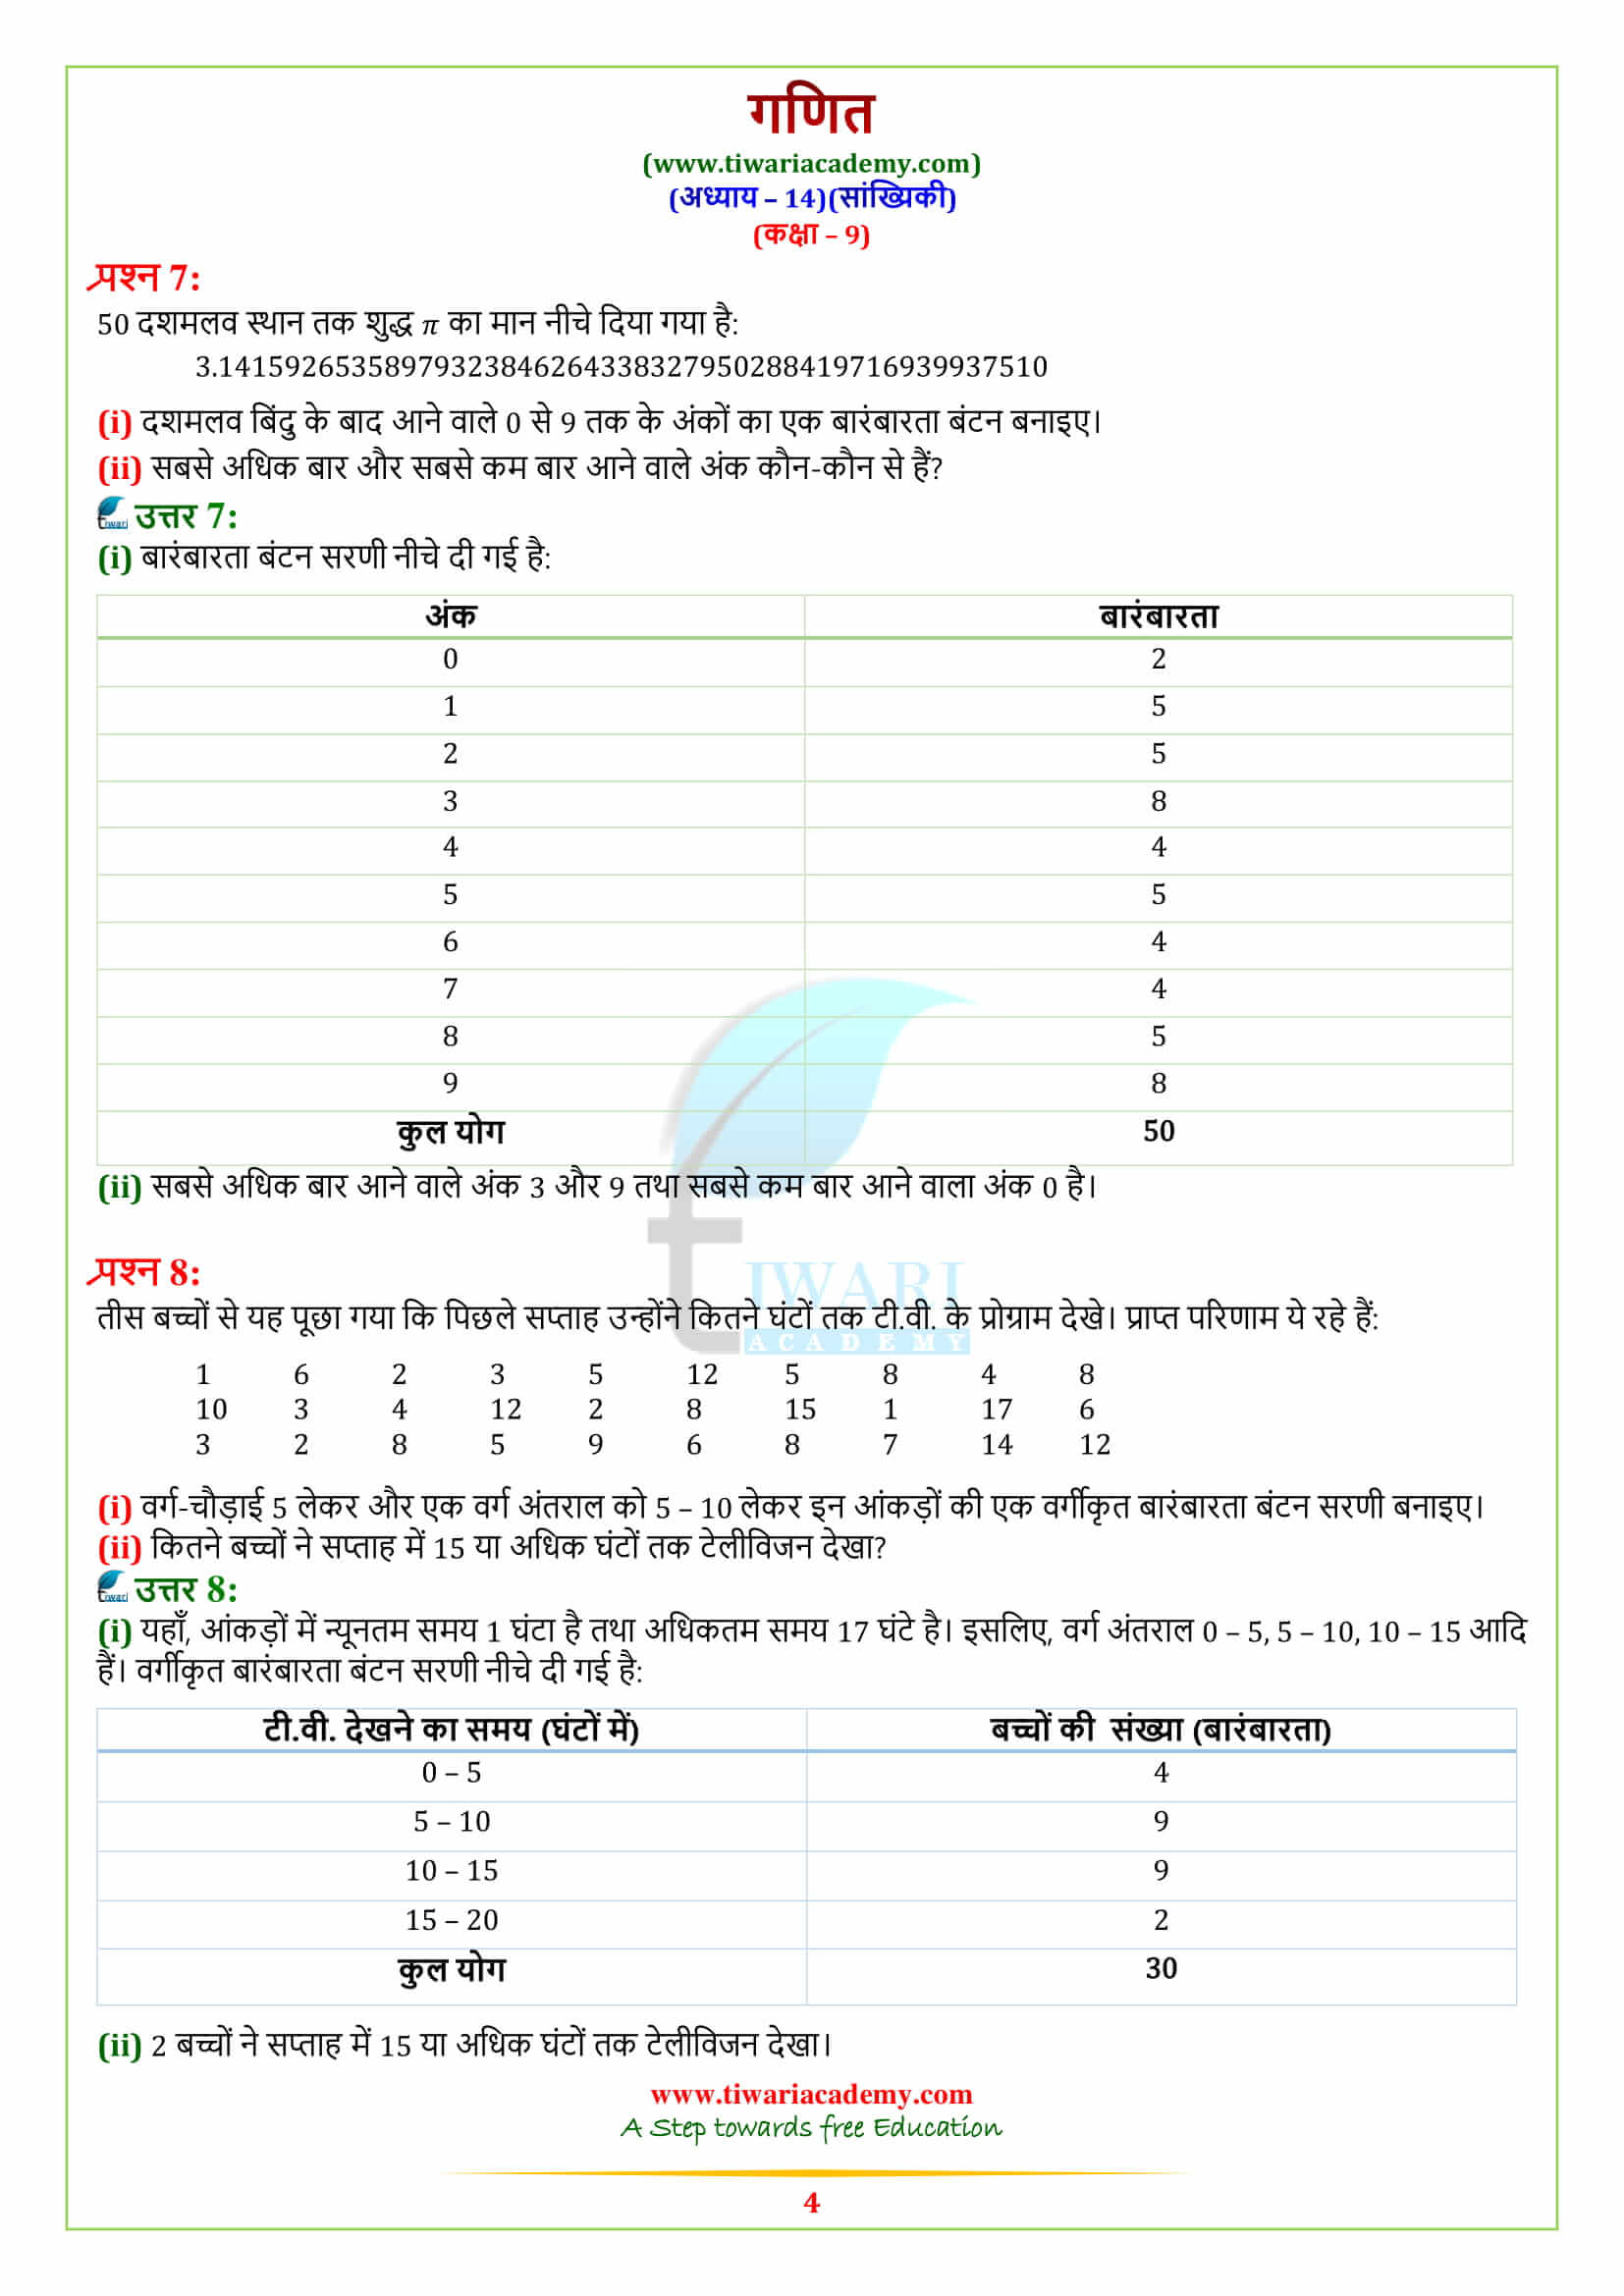
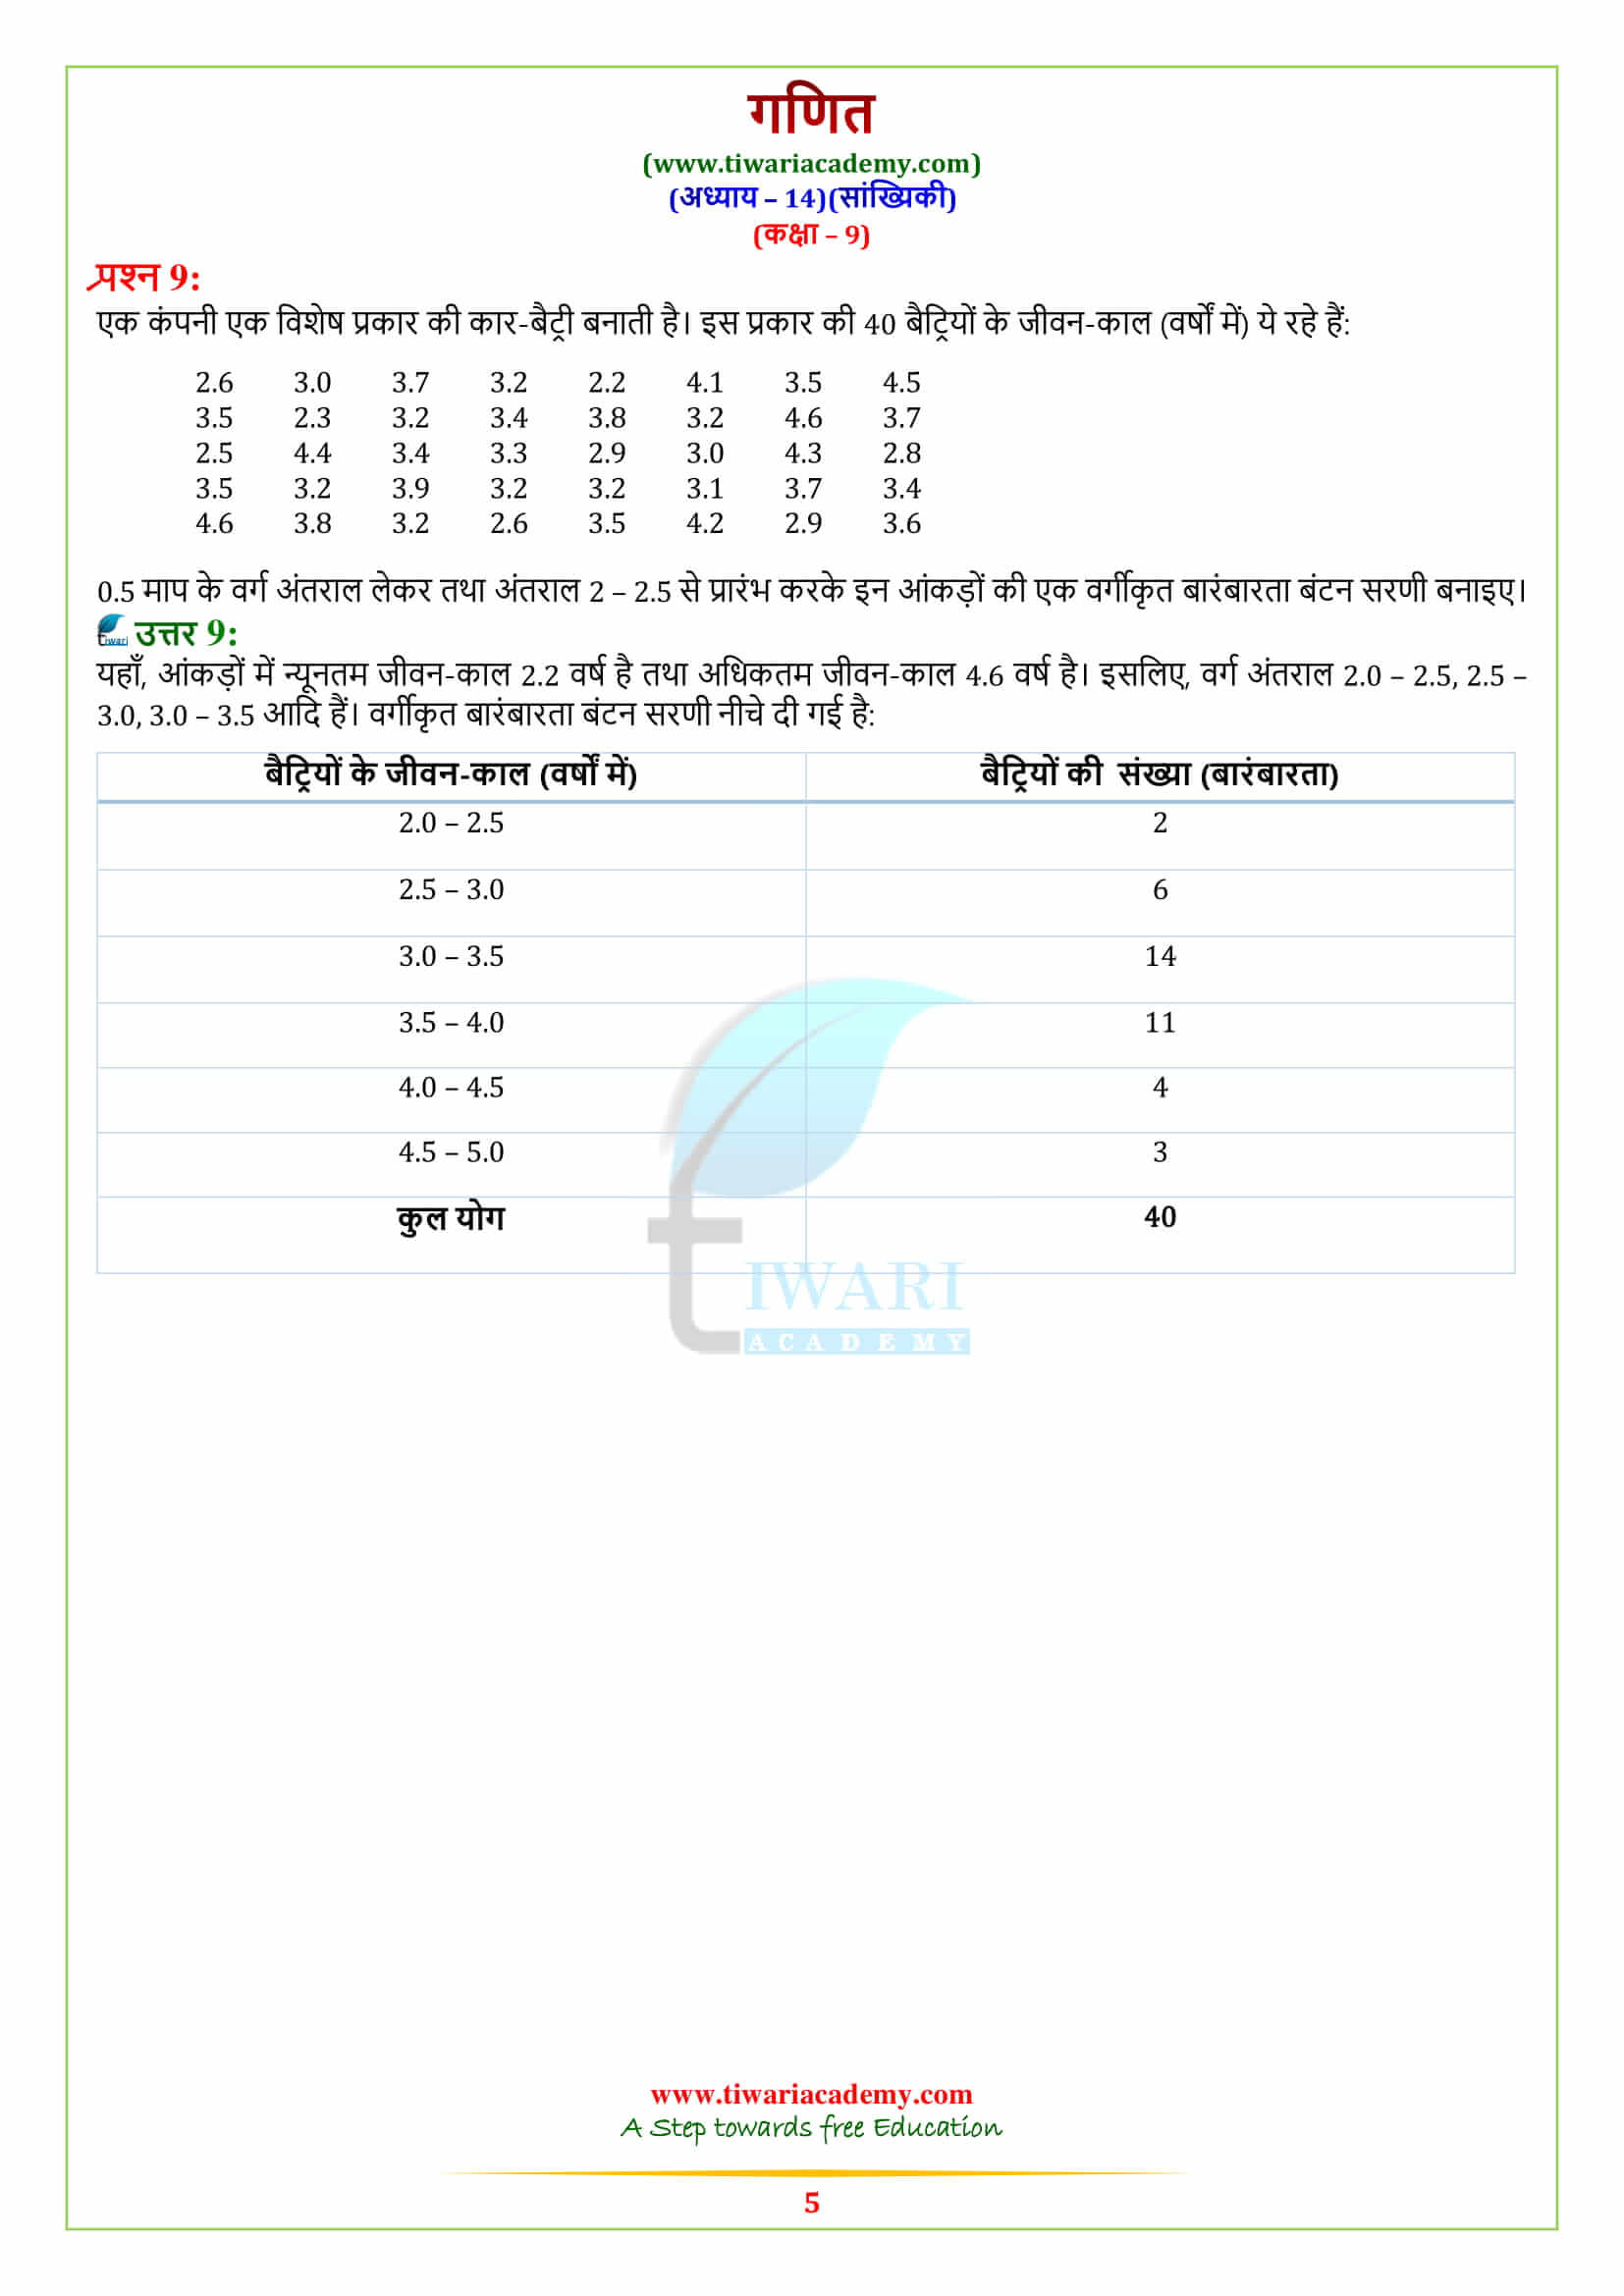
NCERT Solutions for Class 9 Maths Exercise 14.2
Class 9 Maths Exercise 14.2 solutions is available in PDF and video format to download. All the questions are done in step by step process to make the solutions easy.
The possession of Data in Exercise 14.2
In the introduction paragraph 9th Maths NCERT (https://ncert.nic.in/) Book Exercise 14.1, you have learned what you can logically expect from chapter 14. In Exercise 14.2 you will study some of the effective ways of collecting the data. Here we learn about the making of frequency distribution table which is the first step for drawing the graphs.
The good thing about the NCERT study material is that it explains via activities. This will get you insights into the process briefly. Here, most of the data is given to form a frequency table. You will learn to gather data and then display, summarize, examine, and interpret it for finding out the patterns, and derivation of the patterns.
| Class: 9 | Mathematics |
| Chapter: 14 | Exercise: 14.2 |
| Topic: | Statistics |
| Content: | Text and Videos Solution |
| Medium: | Hindi and English |
Presentations of Data in Frequency Table
After completion of previous exercise successfully, you know the data and the ways of collection. As soon the data is gathered and prepared as an investigator will be asked to make the presentation. In simpler words, this means segregation of the various facts and figures.
To perform this you will use various methods that could be described as symmetric flat, bell-shaped, or skewed which you might summarize by measuring the center. As given in Examples 1 and 2 where you will get the detailed information on the table method (NCERT figures 14.1, 14.2, and 14.3). However, that is later thing in the chapter 14 statistics, you will learn about the only basis of the presentations. Most of the questions you will solve with the help of formulae.
Ways of presentations
There are several ways of the presentation of the data which you can see and understand in chapter 14. NCERT Solutions for Maths class 9 Exercise 14.2 deals with the questions of frequency tables. Let’s delve deep into the topic of the presentation.
Text presentation – Text is the initial and foremost important method of conveying information as it is used to represent results, and trends, and get us the contextual information. In this method, data are basically presented in paragraphs. Text is used to give an interpretation of certain data. The same method that you used in the previous chapters like mensuration, Geometry, Algebra, and all.
Frequency Table Presentations
Frequency Table presentation is a form of presentation that you have already seen at the beginning of the chapter 14 statistics from NCERT solution for class 9th Maths. This states information that has been converted into words or numbers in rows and columns.
MS Excel is a document that is one of the real-life examples that you are going to use outside the premises of your school. It is one of the fundamentally strong and appropriate ways for presenting single information. It can present both quantitative and qualitative information.