by Tiwari Academy Team
NCERT Solutions for Class 9 Maths Chapter 12 Exercise 12.1 Statistics in Hindi and English Medium updated for academic session 2026-27. Questions of ex. 12.1 class 9th Maths are modified as per the revised syllabus and new NCERT books for CBSE 2026-27.
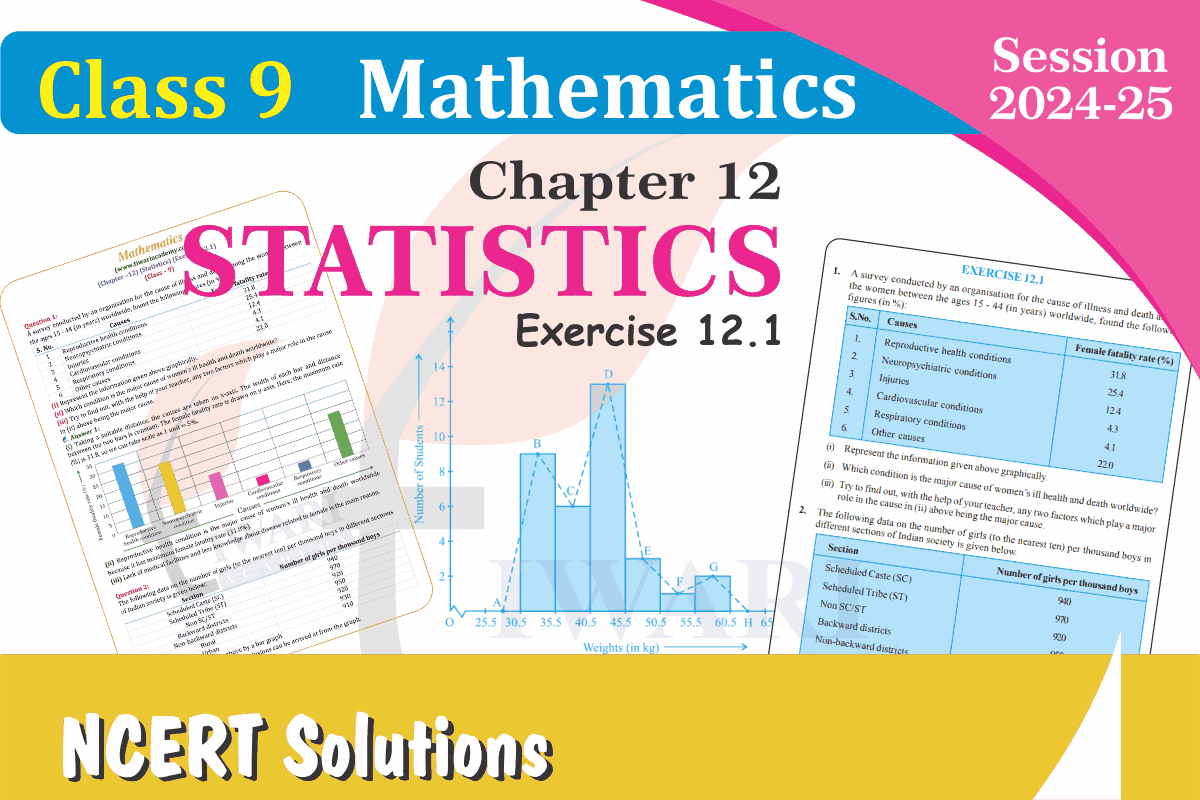
NCERT Solutions for Class 9 Maths Exercise 12.1
All the questions of Exercise 12.1 in class 9 Maths are given here in the format of PDF file and Videos. Solutions and explanation of each question is made easy to understand. Take help of videos, if you are facing any difficulty through PDF NCERT (https://ncert.nic.in/) Solution.
Importance of Tabular Representation
At the end of activities, you will solve some questions, where you will be asked to segregate the information from Text data representations. The questions in the exercise seem long but the process of obtaining the information is easy.
This is why most teachers and education experts share the same view for solving statistics questions. By making the tabular representation from the text data is the important and lengthy part of the questions, which makes attaining the core information for inputs easier to get the solutions.
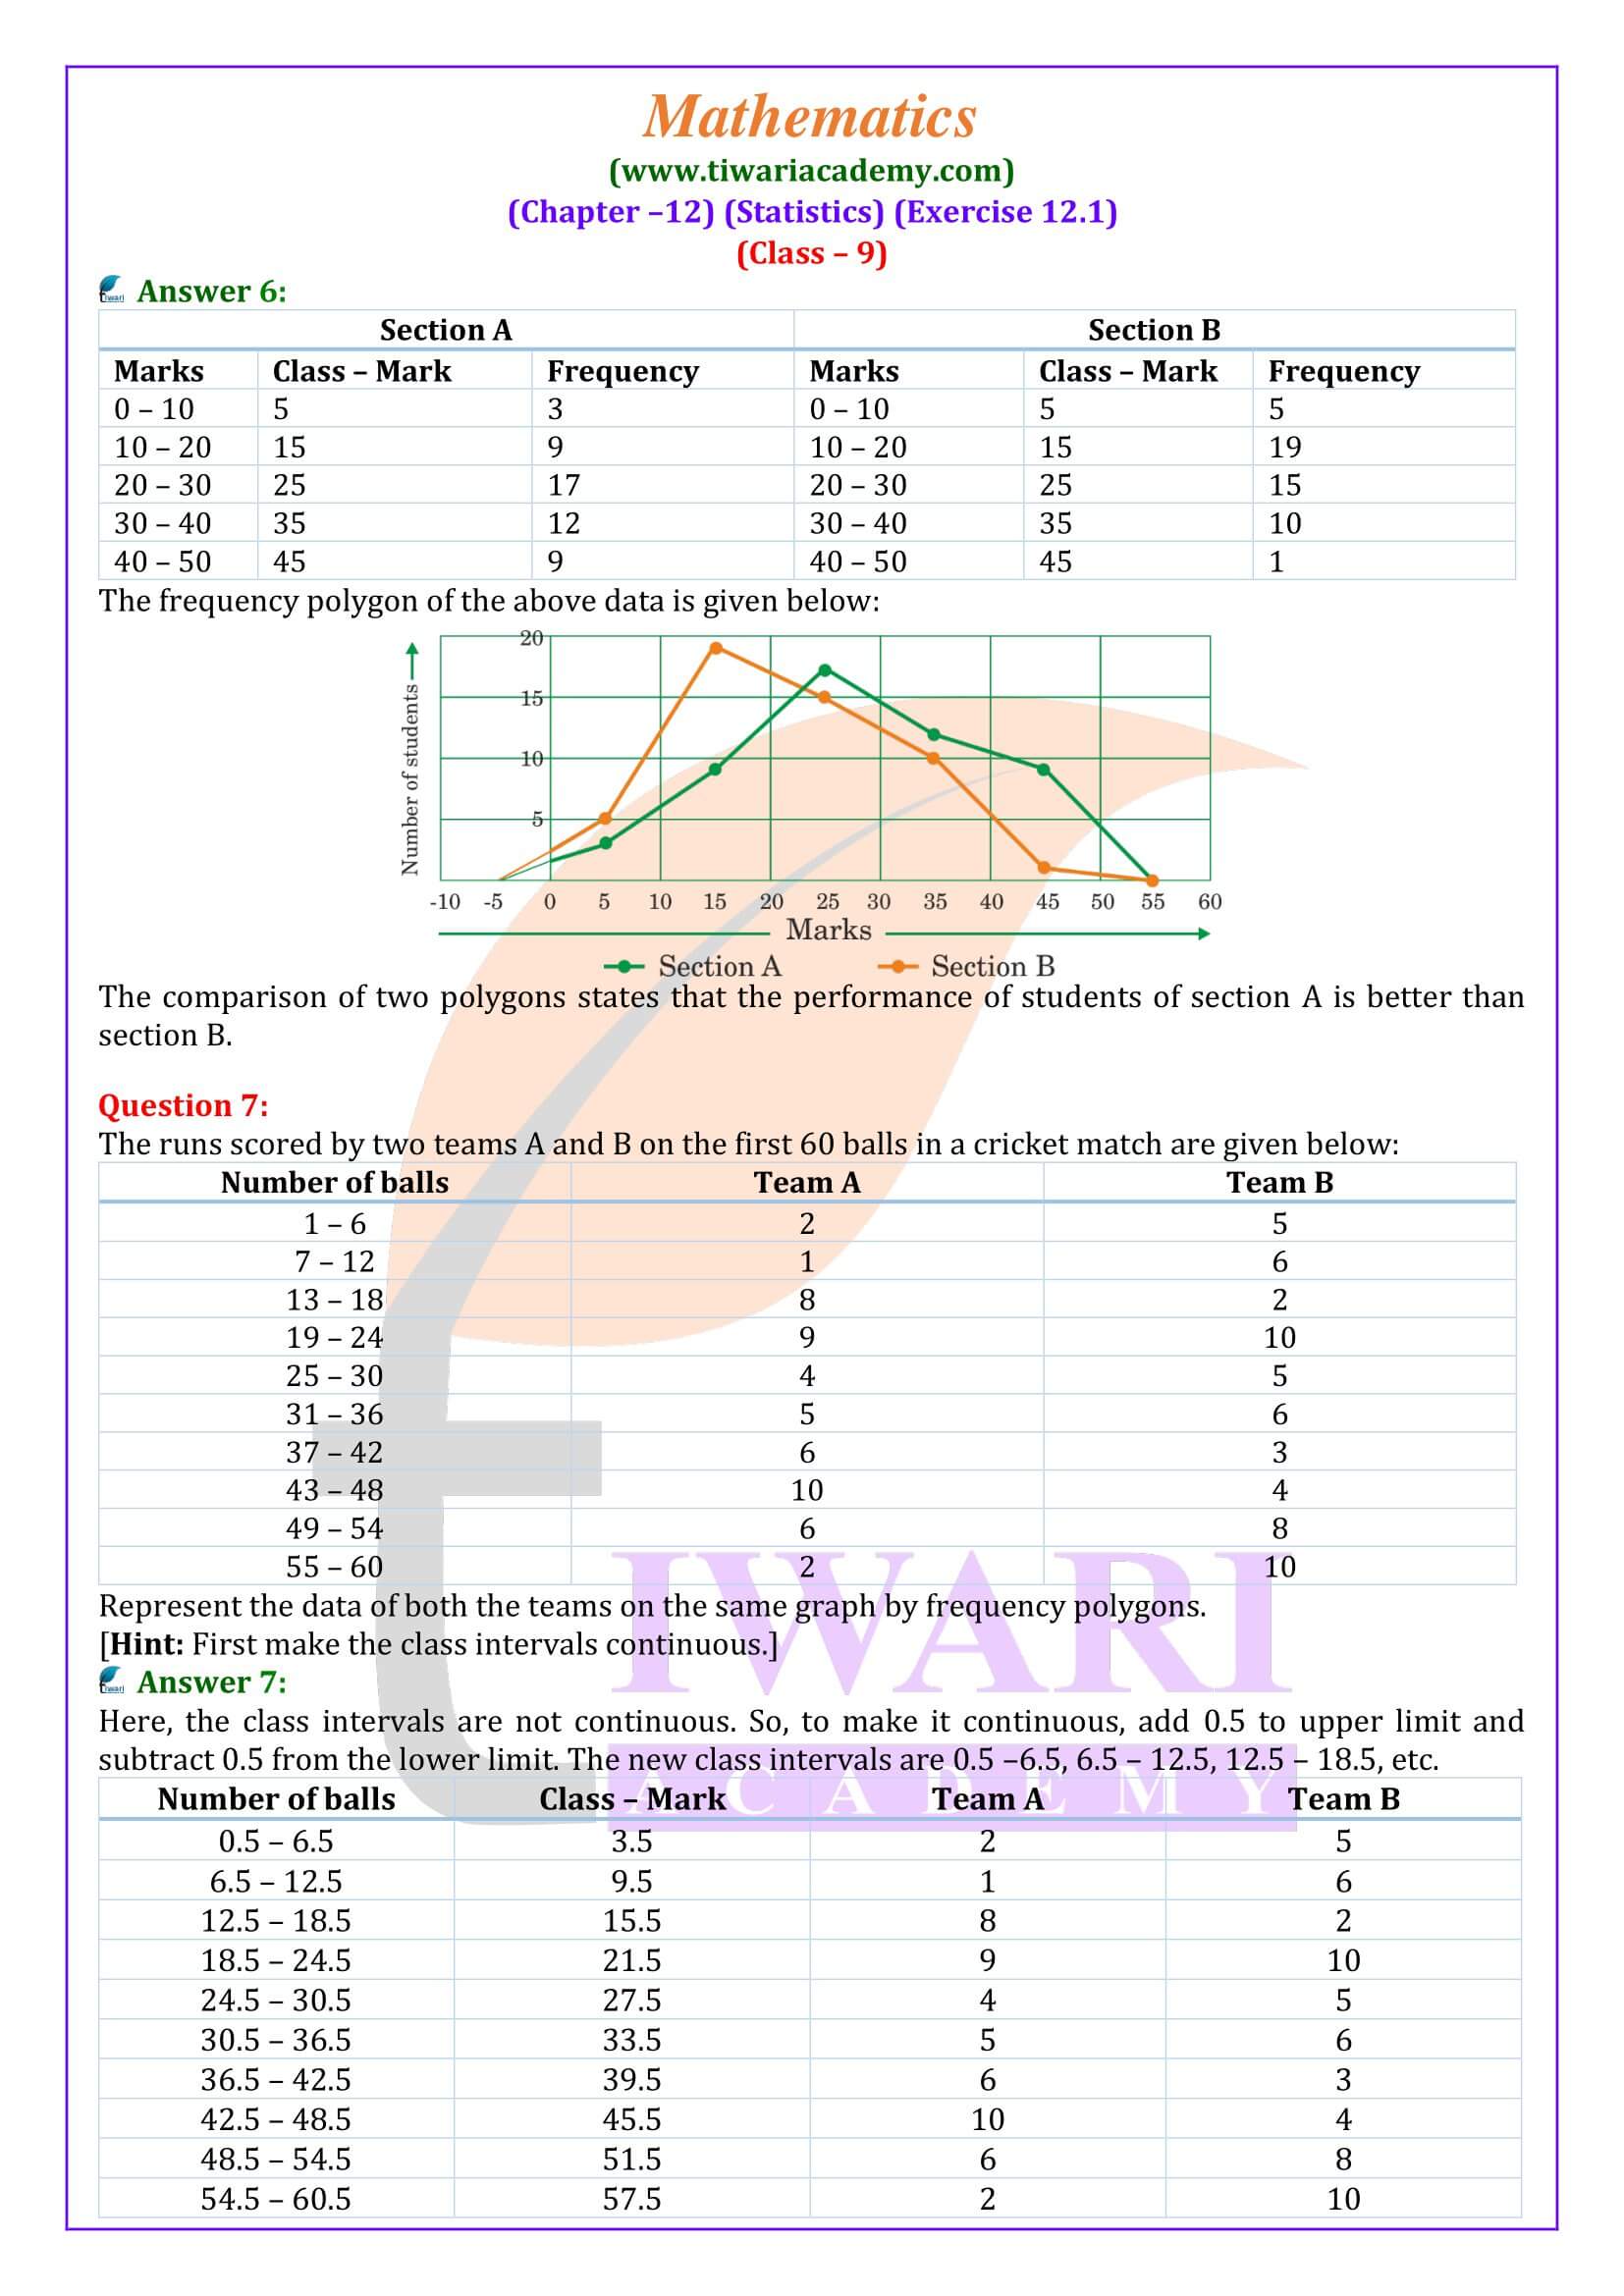
| Class: 9 | Mathematics |
| Chapter: 12 | Exercise: 12.1 |
| Topic Name: | Statistics |
| Mode of Solution: | Text and Videos Format |
| Academic Session: | CBSE 2026-27 |
| Medium: | Hindi and English Medium |
Graphical Representation of Data
Continuing the presentations of data will get you to exercise 12.1 the graphical representation of data. It is one of the best methods that use the data and then transfer it to graphs. Graphical presentations are usually used for simplifying complex information.
This graphical presentation is used for emphasizing data patterns and for summarizing, explaining, and exploring quantitative data. Class 9 Maths Exercise 12.1 deals with bar graphs, histograms, and frequency polygons.
Types of Graphs in Class 9 Maths Exercise 12.1
Graphs are often used to manage large numbers of data effectively. Most of the readers and reviewers choose the information in graph formats as it is easy to understand. Share market is one of the classic examples of graphical representation.
As the graphical representation usually handles large quantitative data, it also consists of several sub units of presentations, like – a bar graph, histograms of uniforms width, varying widths, and frequency polygons.
Bar Graph representations
In statistical mathematics, a bar graph is used to indicate and compare measurements or values in the discrete category, frequency, or other parameters. The size and the quantity of the bars depend upon the complexity of the data it represents or whether it goes vertically or horizontally.
We have studied the construction of the bar graph in the previous class but in chapter 12 statistics you will learn to represent the values. It is used to take the information and use it for further calculations. Example 5 in NCERT Book shows simplest form of the bar graph representation. Similarly, you may check the variation in the data in another example with figure.