by Tiwari Academy
NCERT Solutions for Class 4 Maths Mela Chapter 14 Data Handling for Session 2025-26. It provides clear, child-friendly explanations to help students understand how to collect, organise and interpret data. This chapter covers important concepts like asking the right questions, using tables, pictographs and comparing data through real-life examples such as favourite subjects, colourful golas and games. These solutions are written in simple language, making learning data handling easy, engaging, and effective for Class 4 students preparing for exams and daily practice.
Class 4 Maths Mela Chapter 14 MCQ
Class 4 Math Magic Chapter 14 MCQ
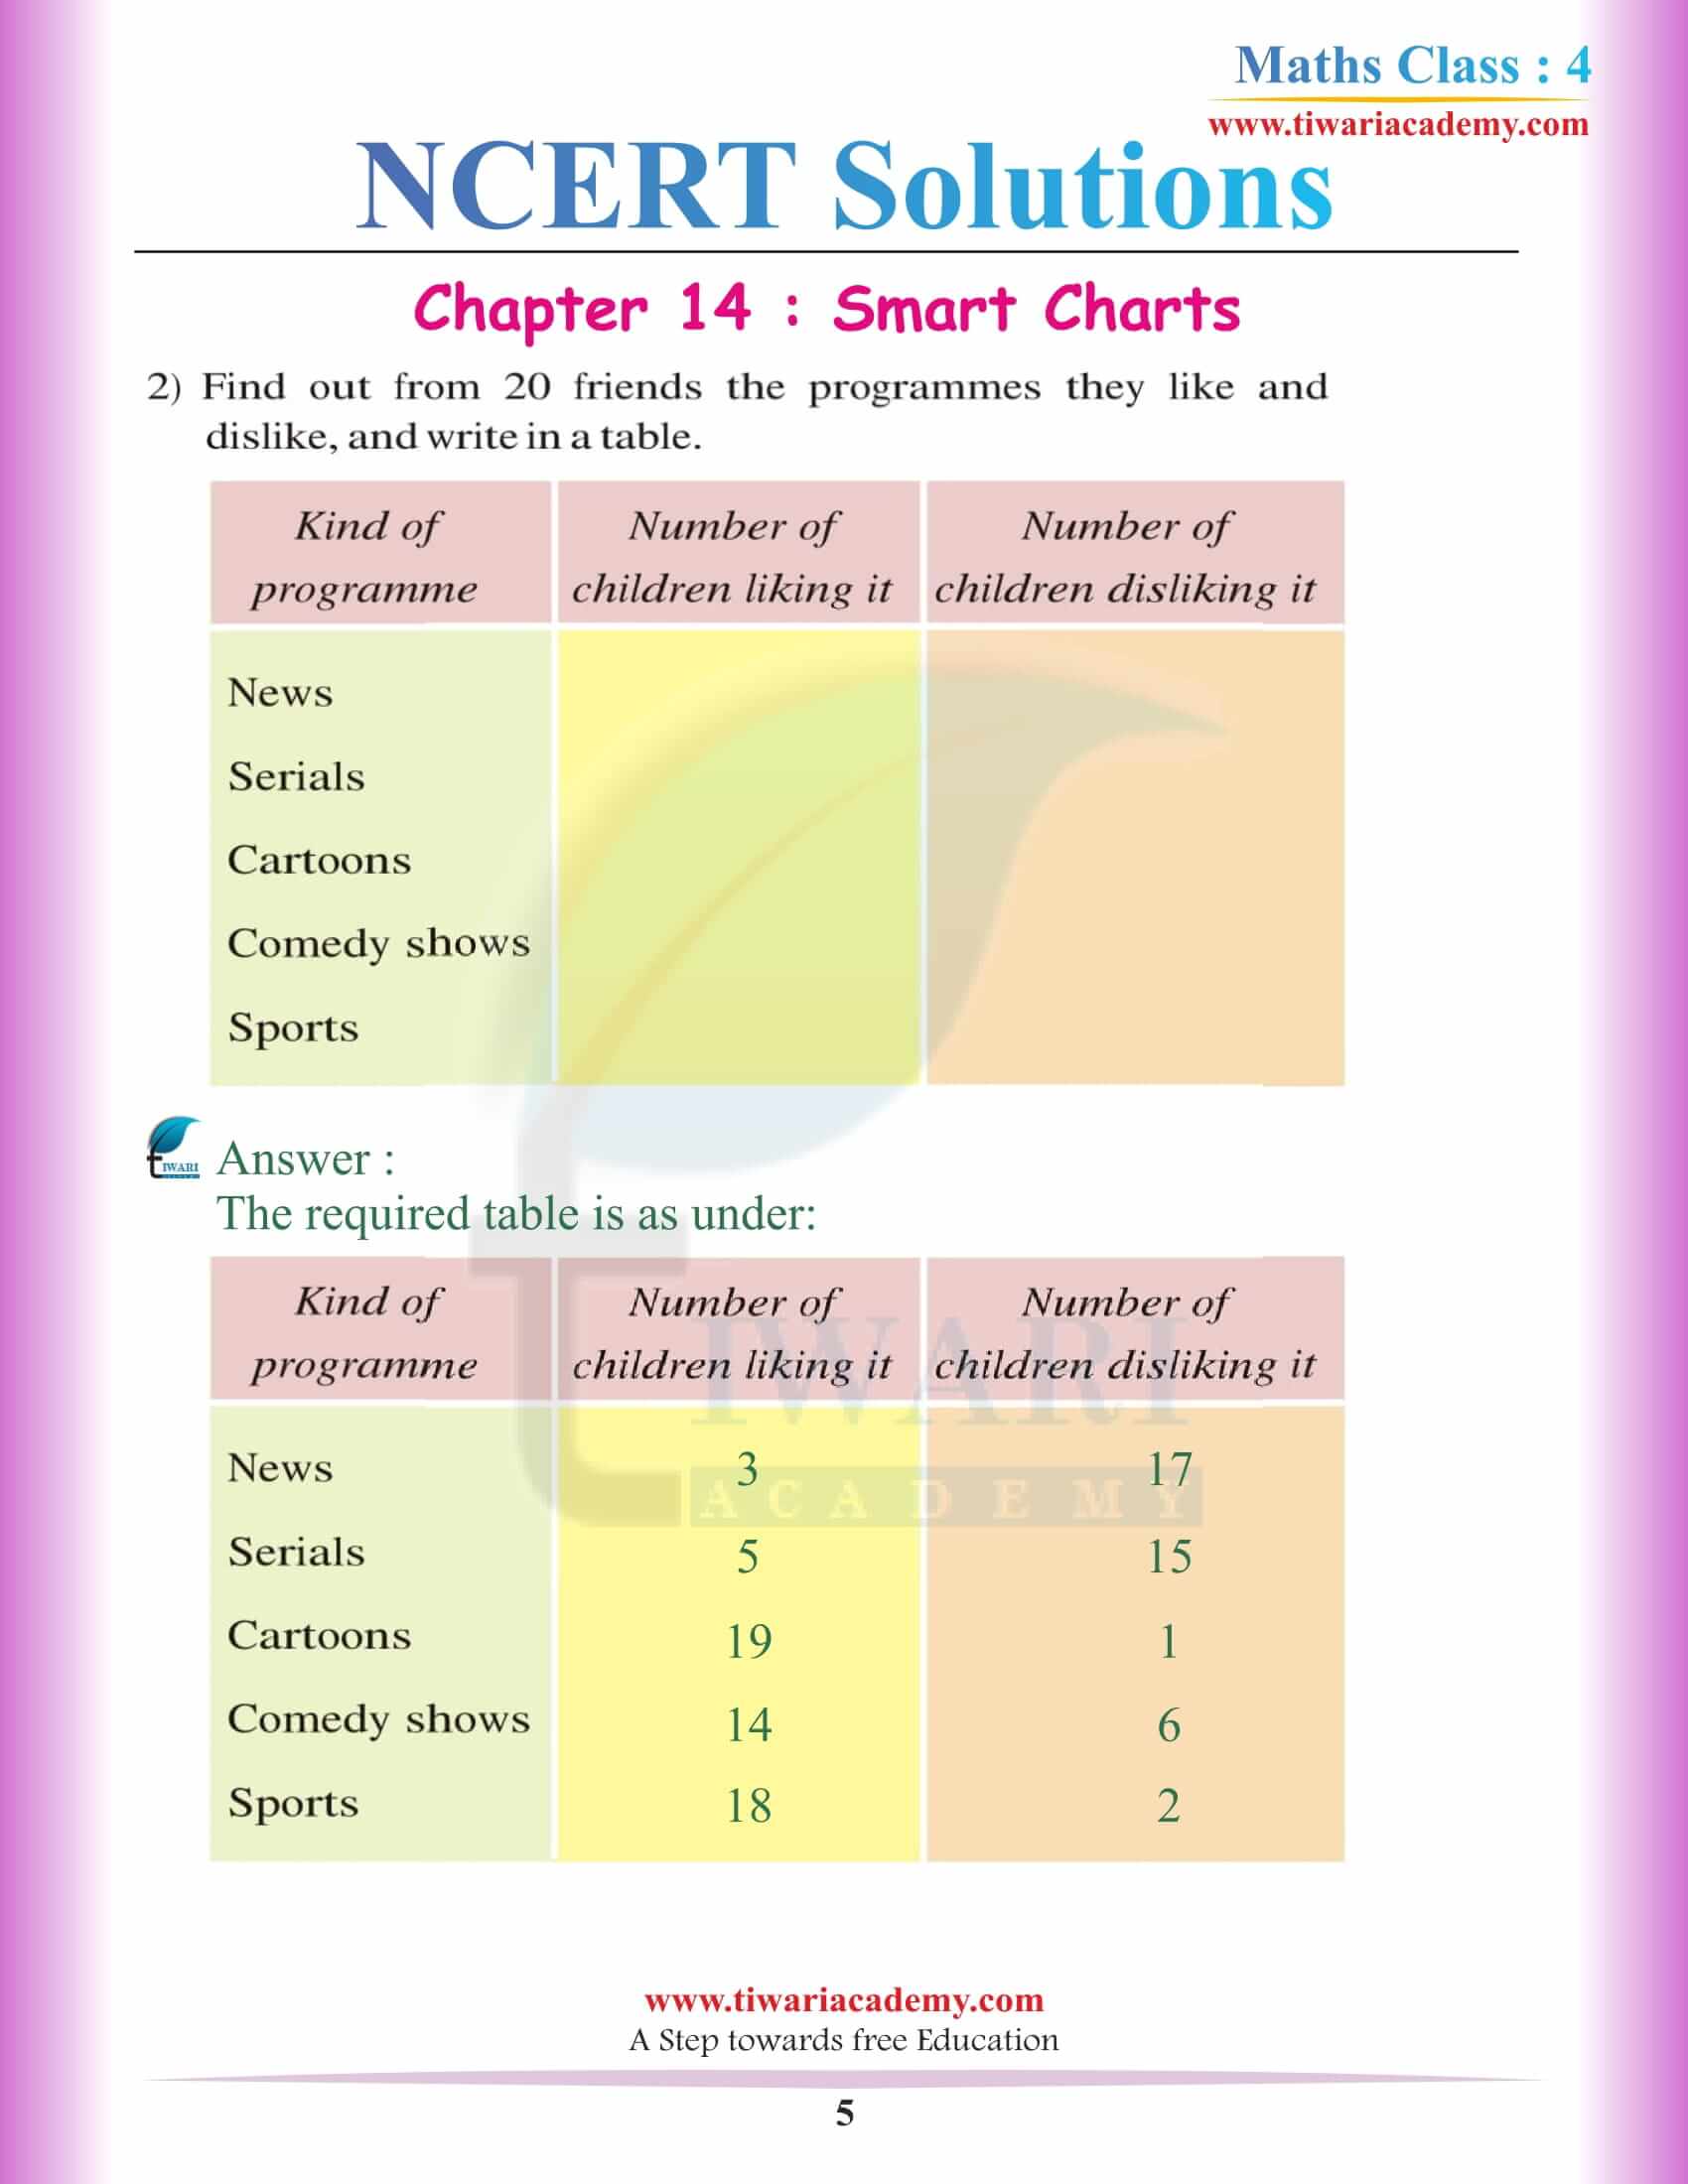
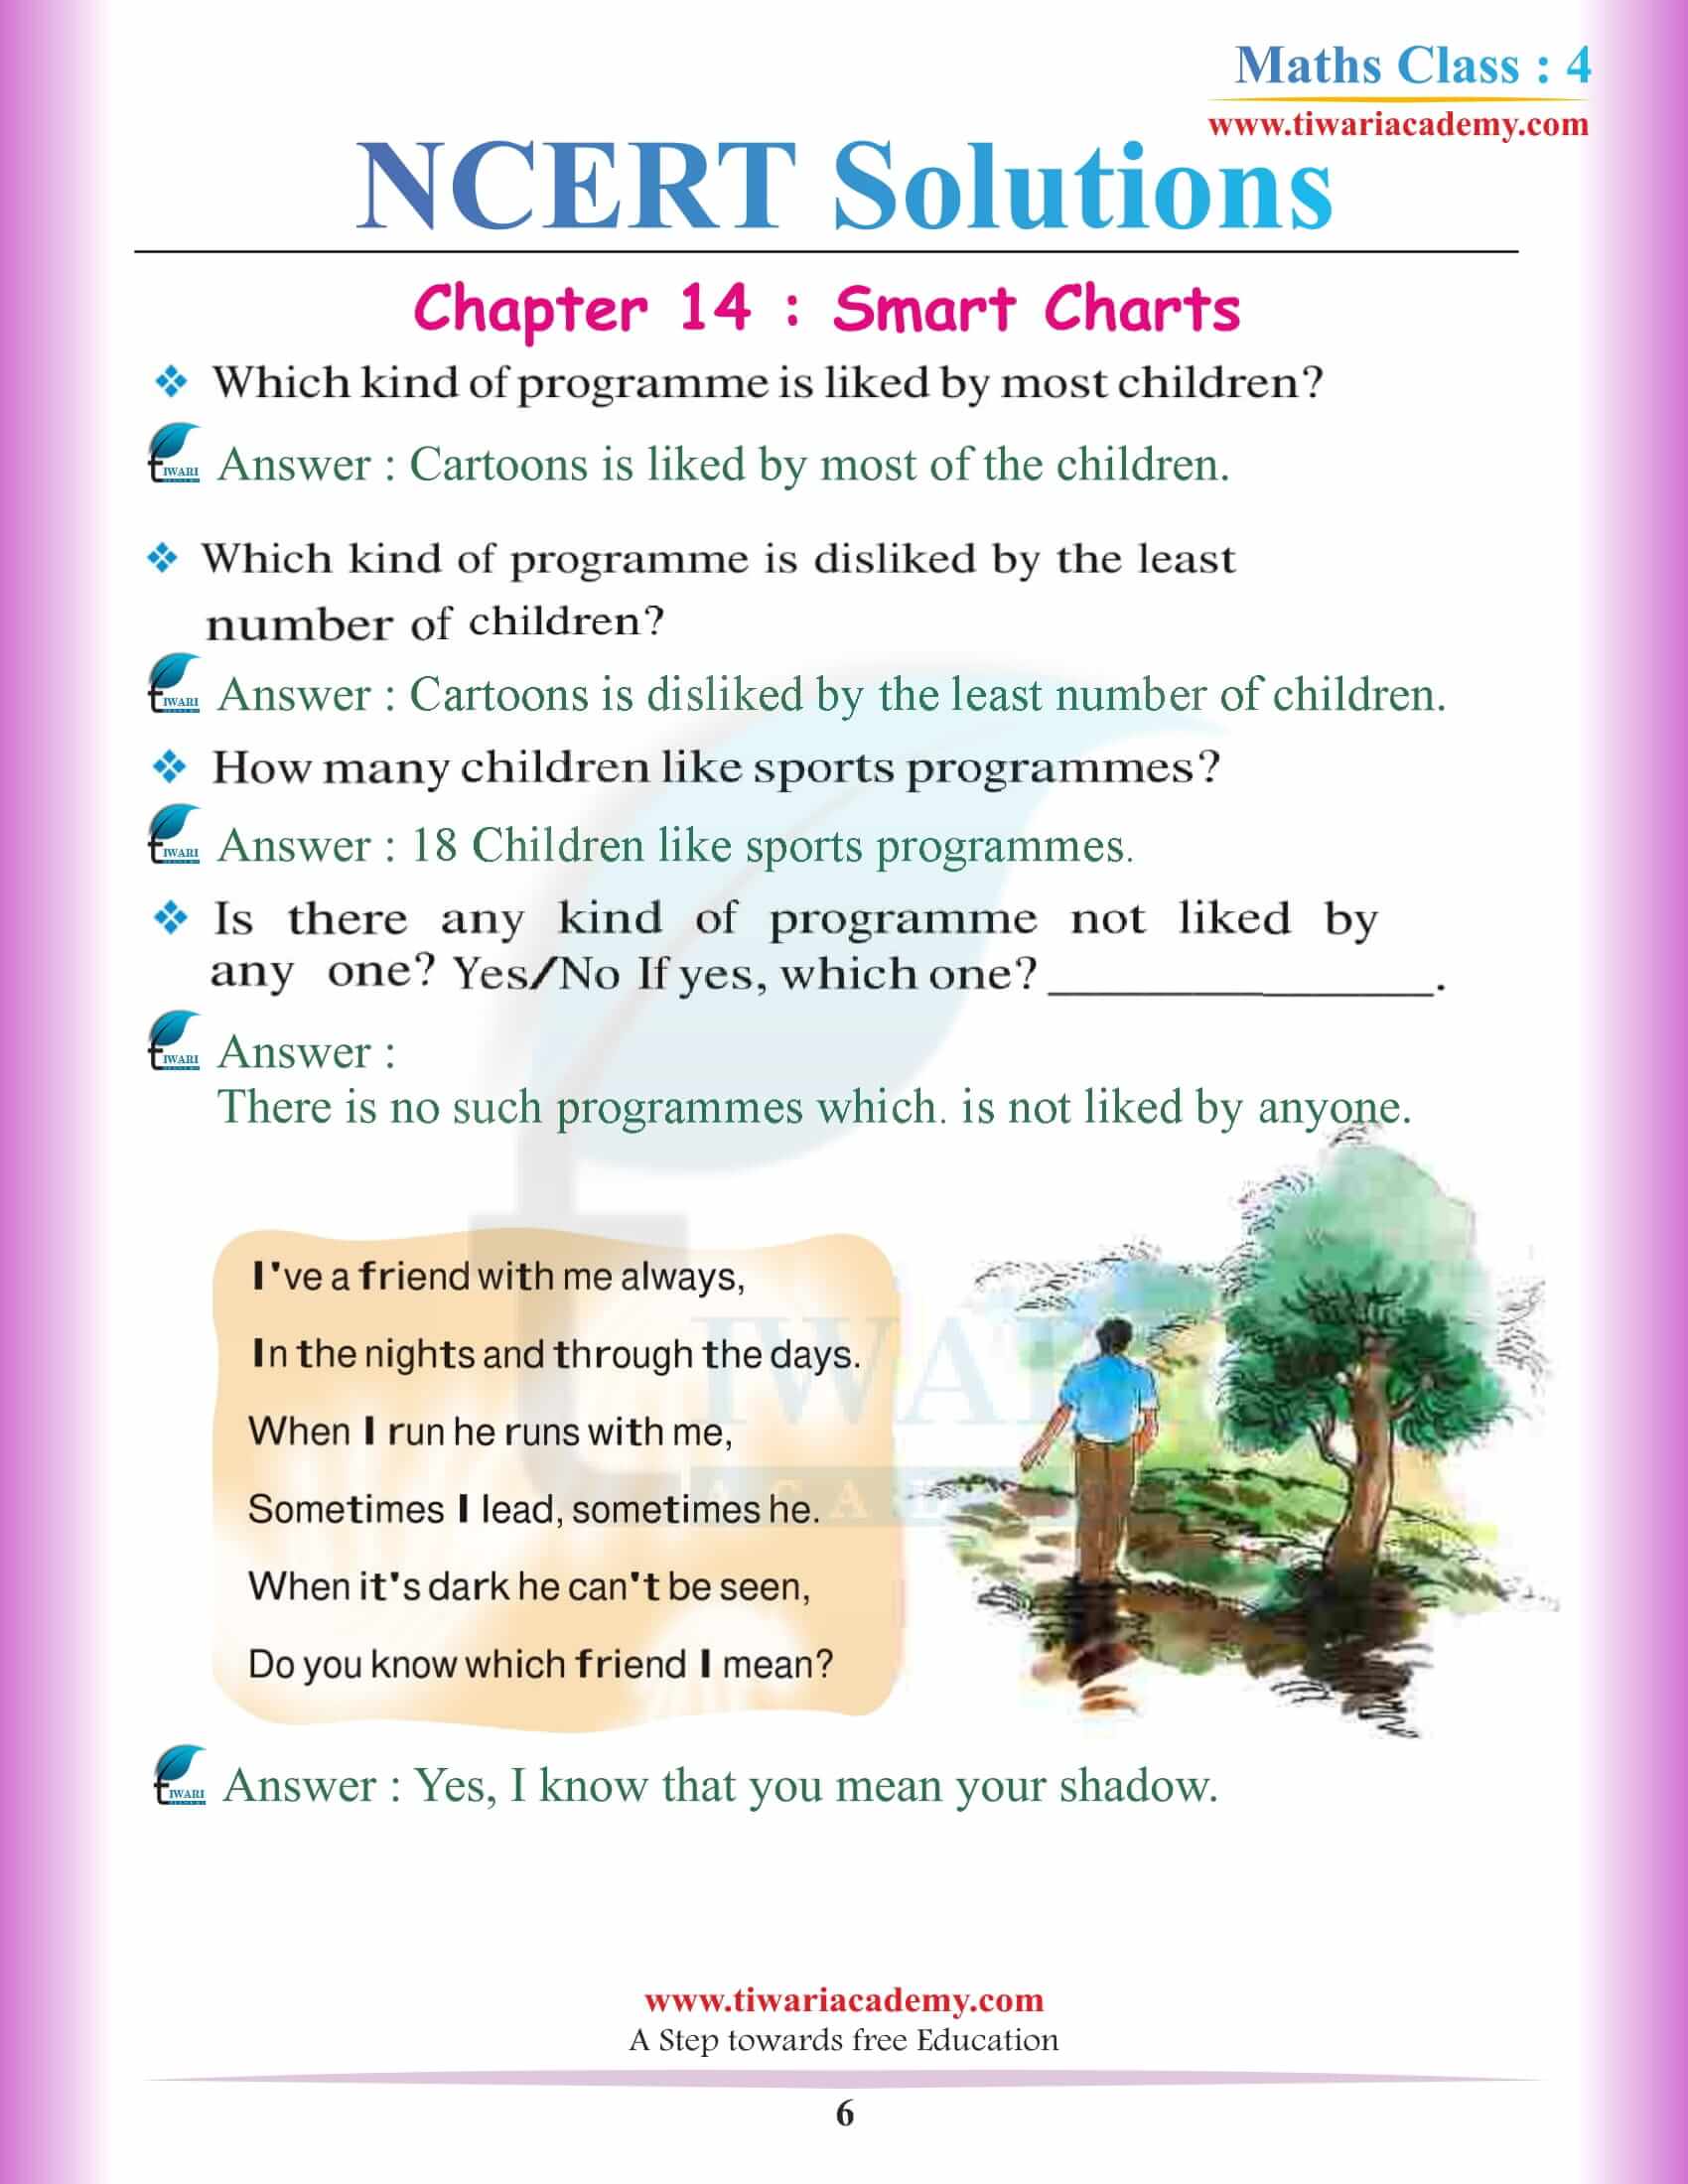
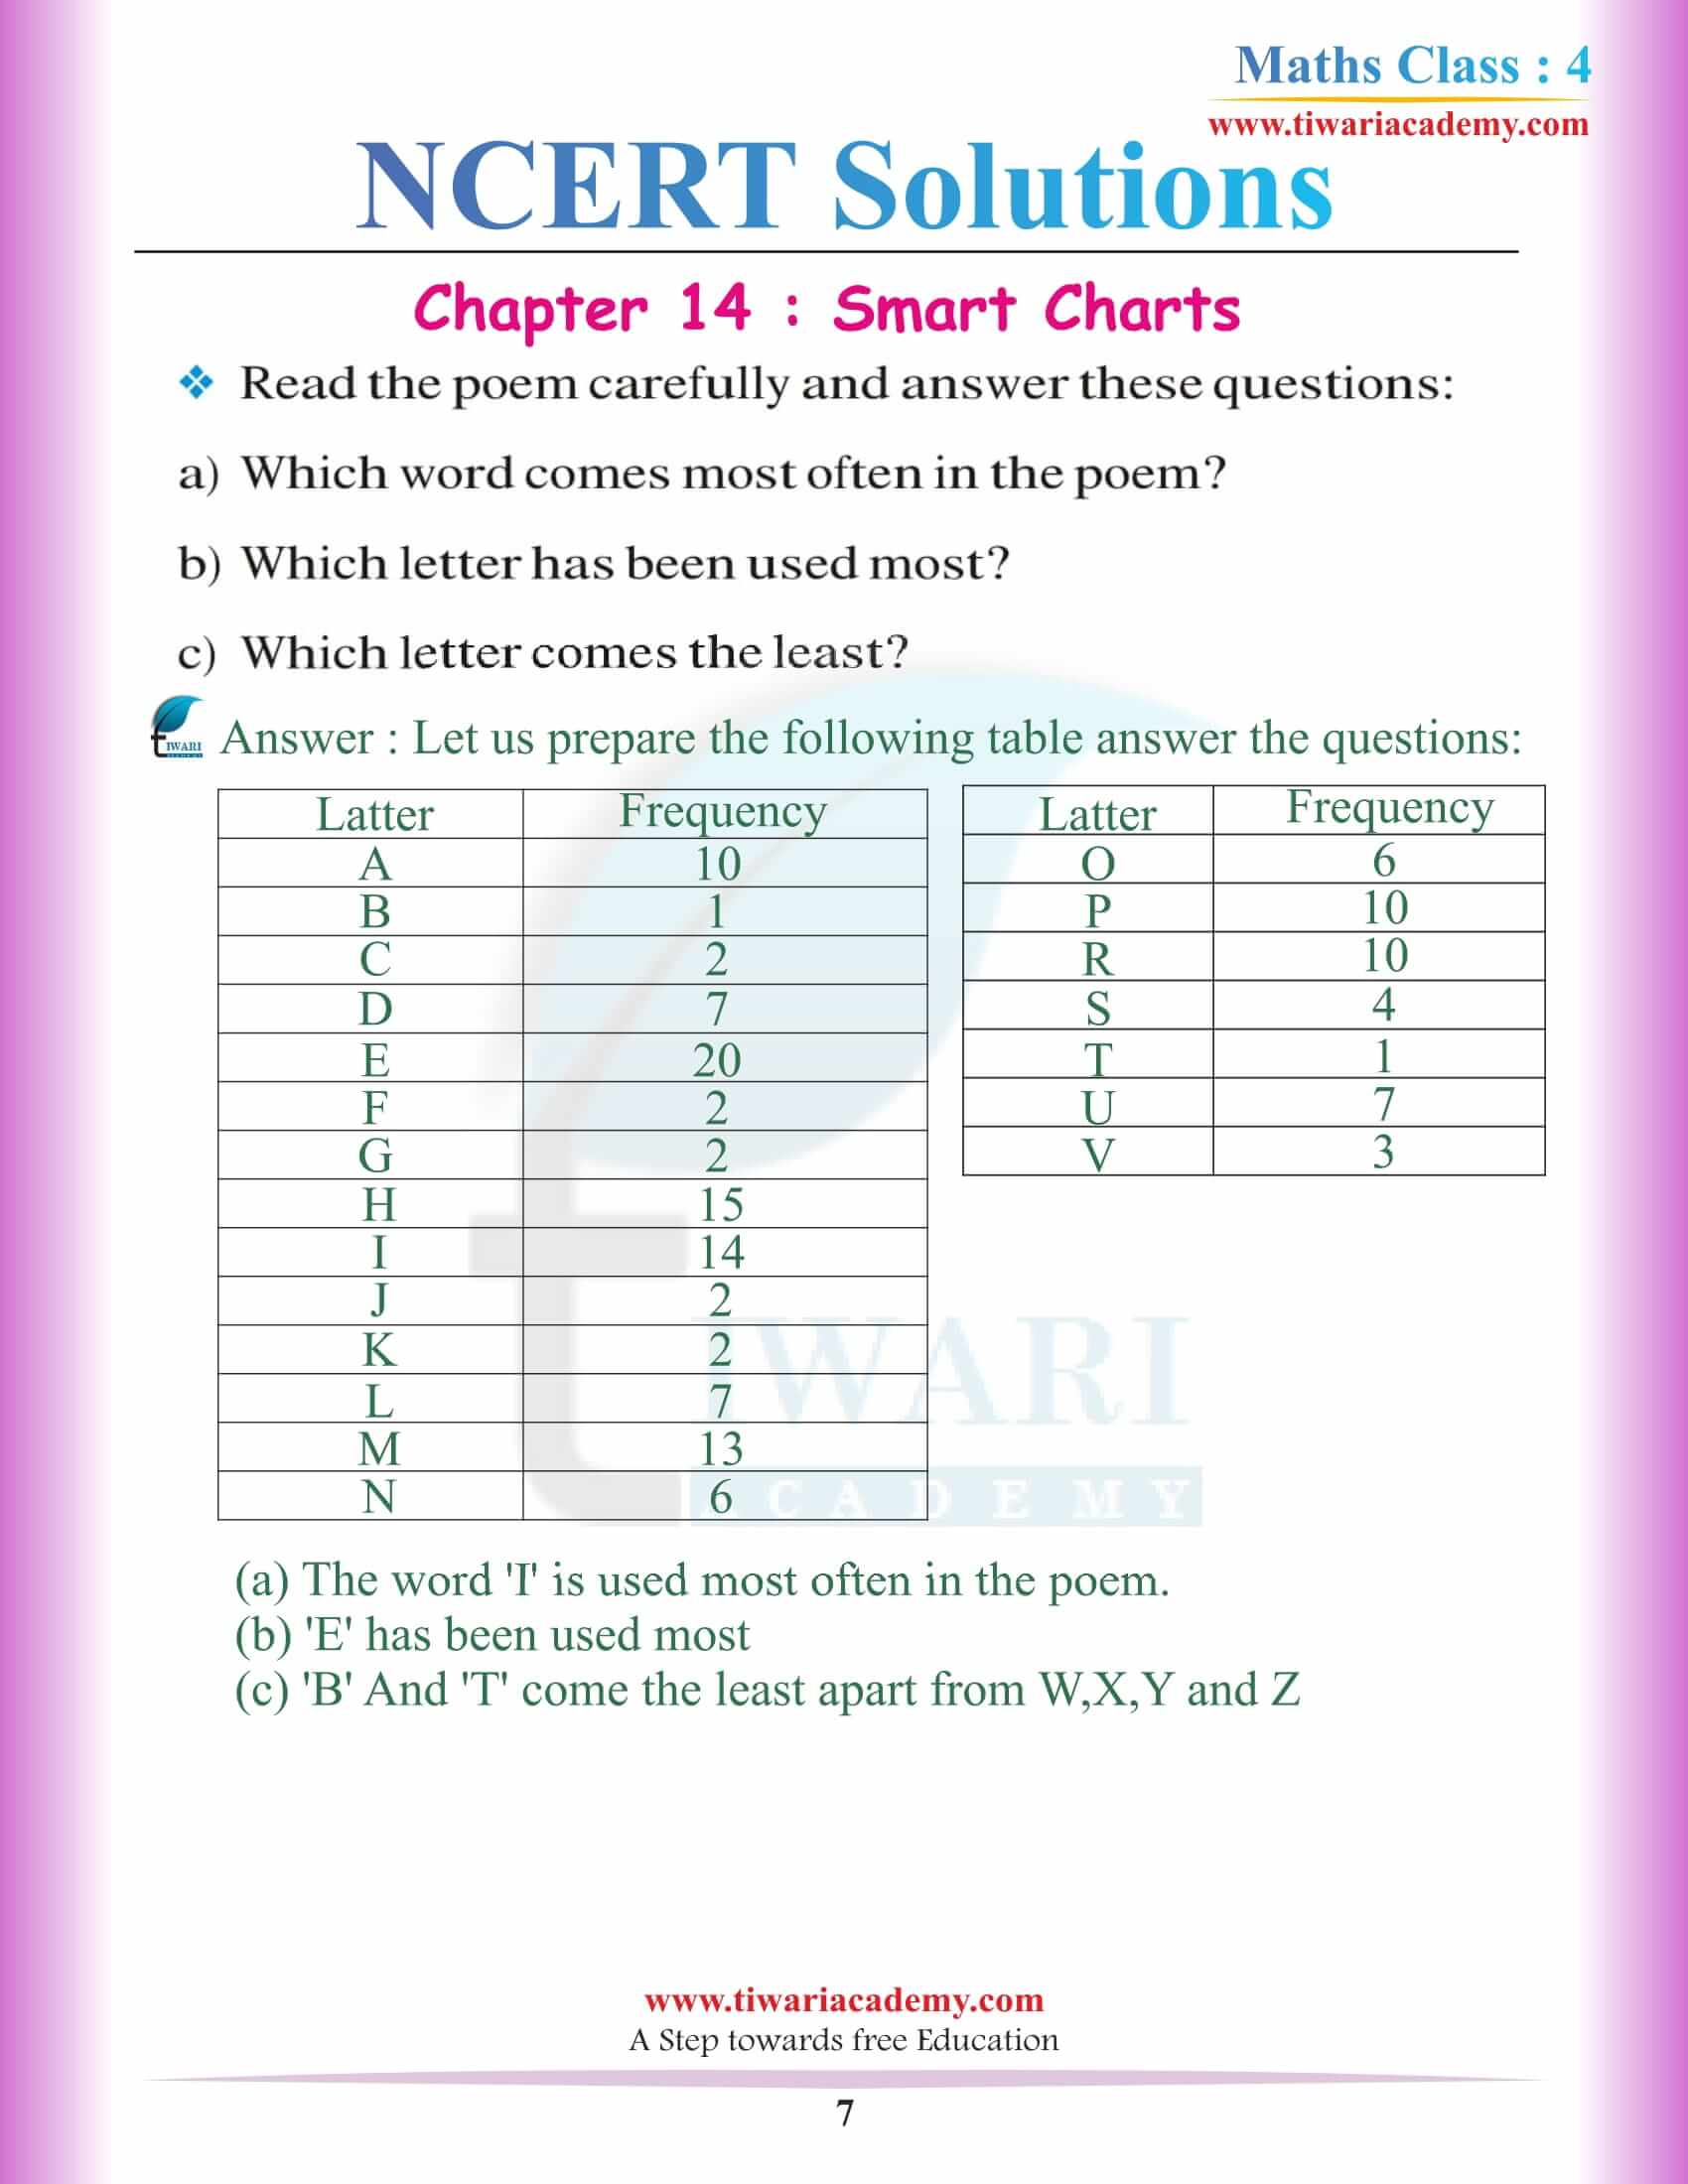
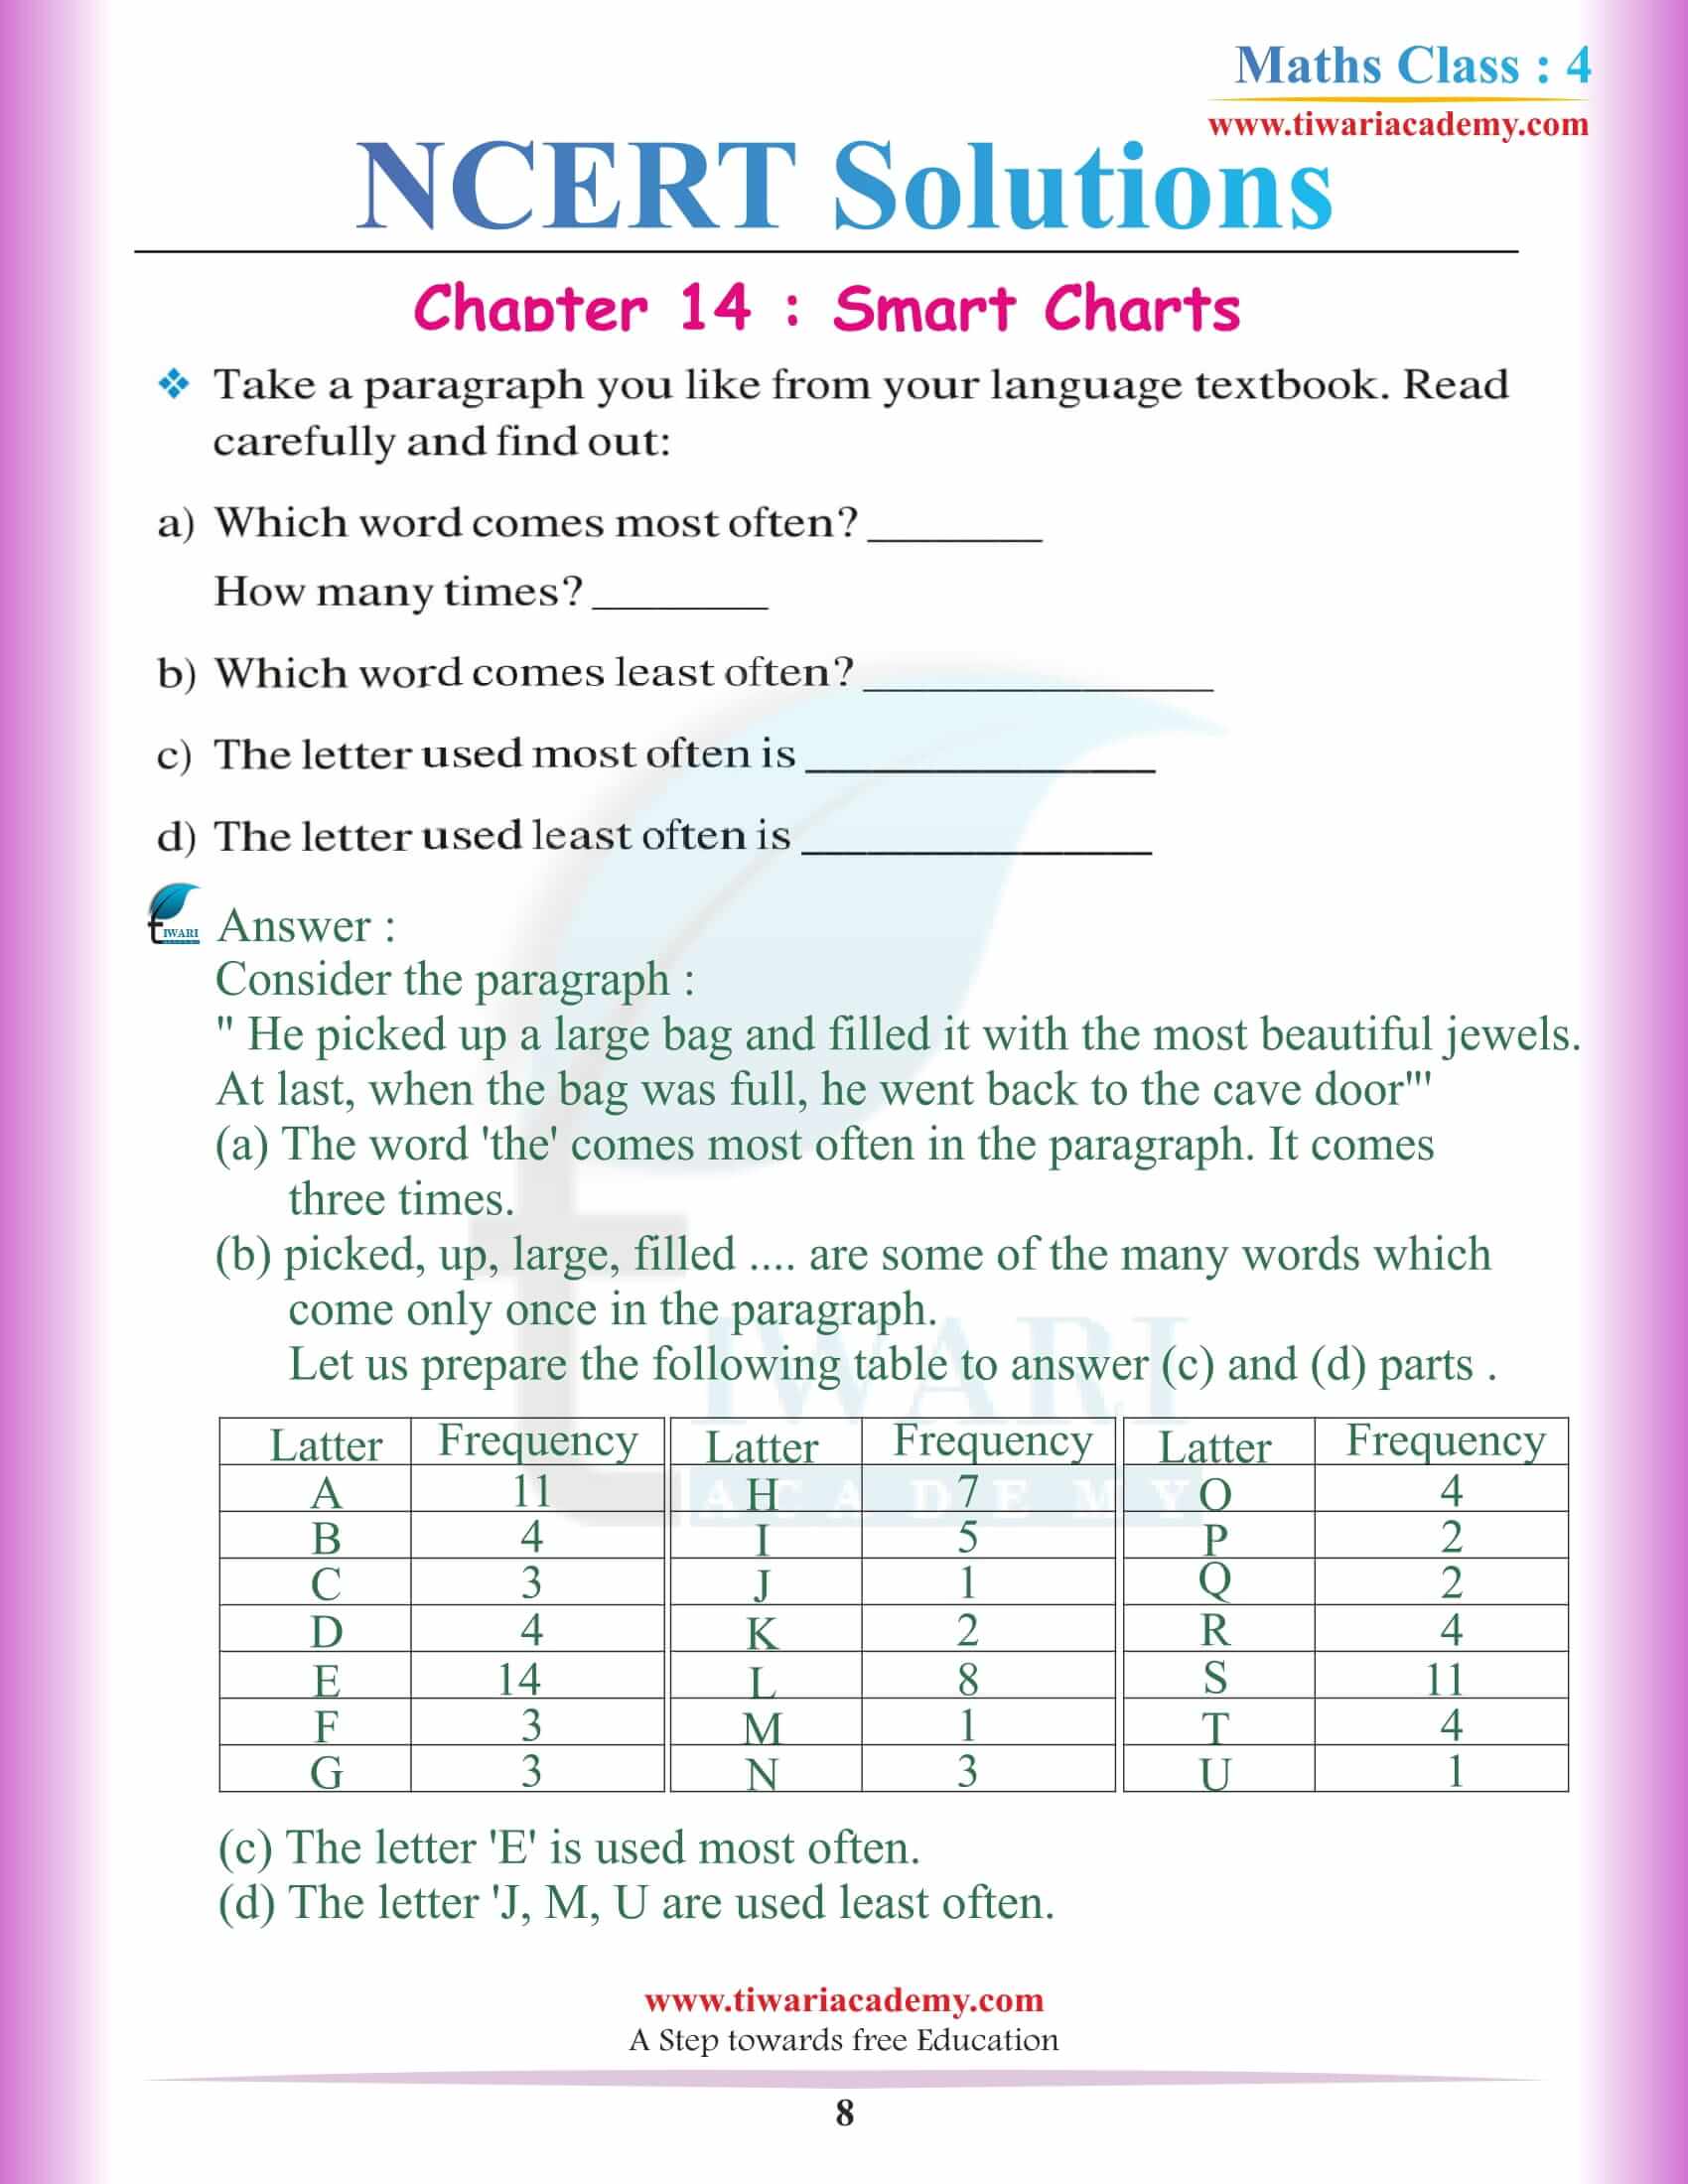
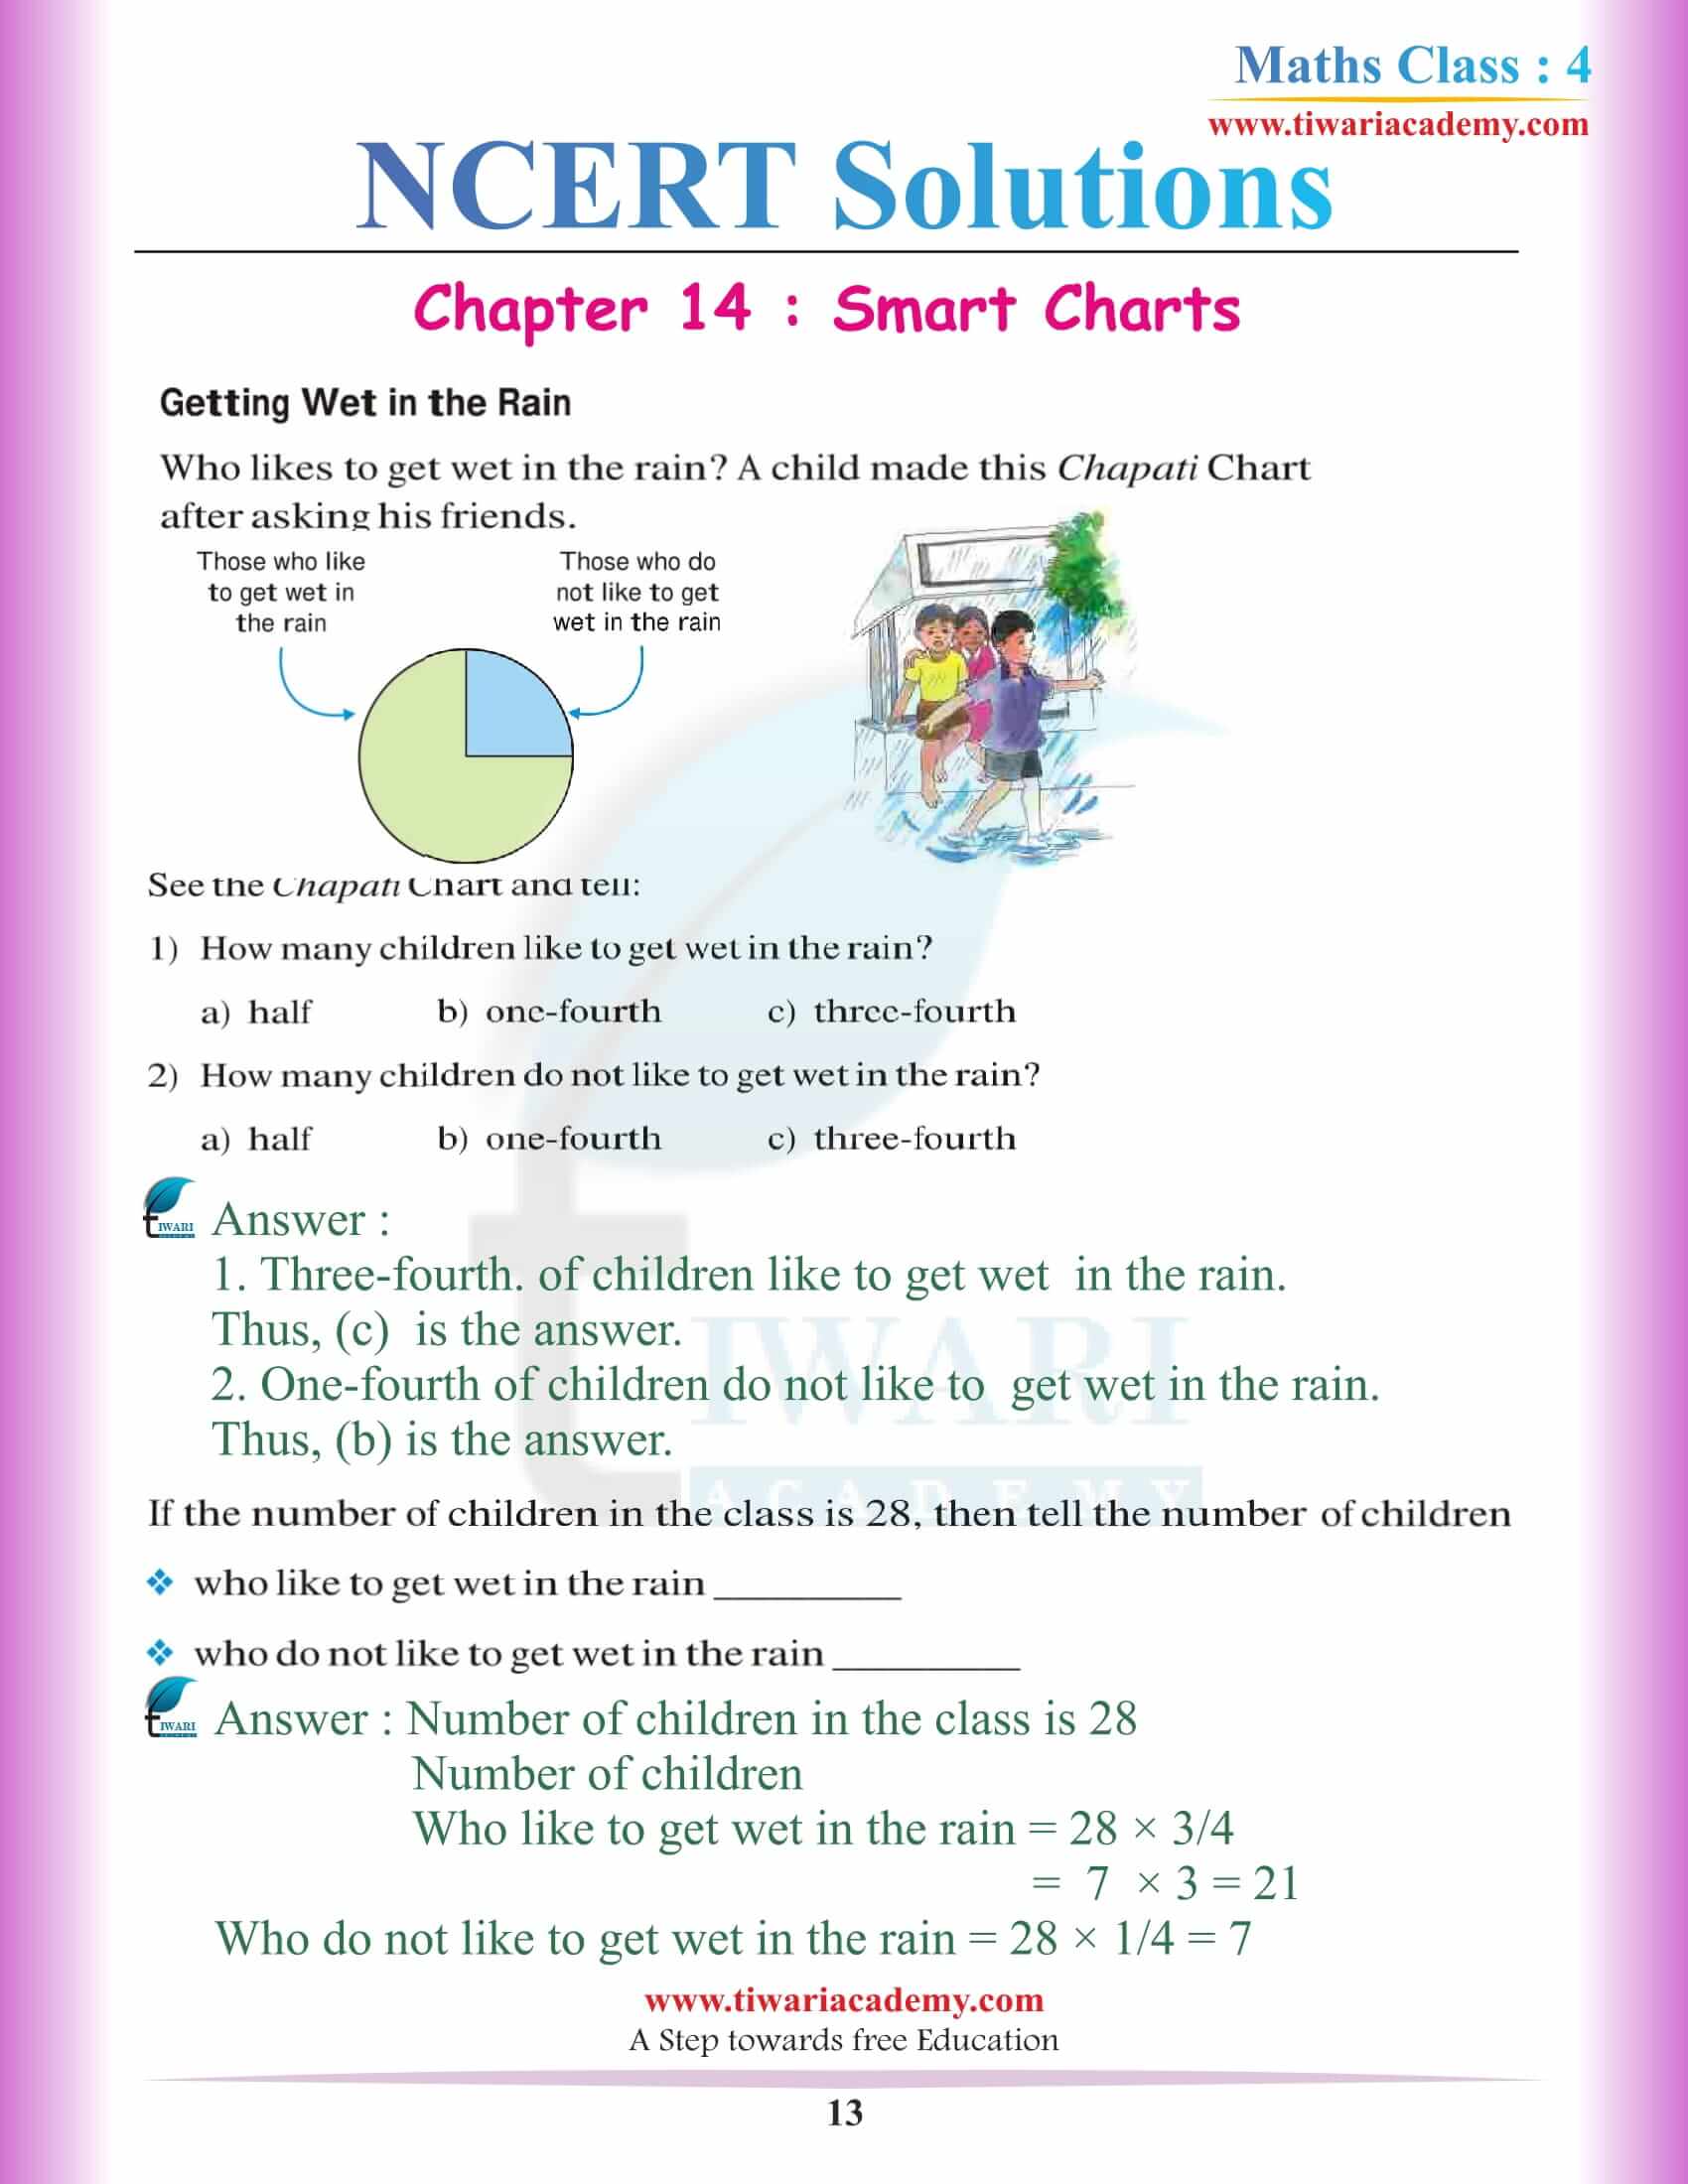
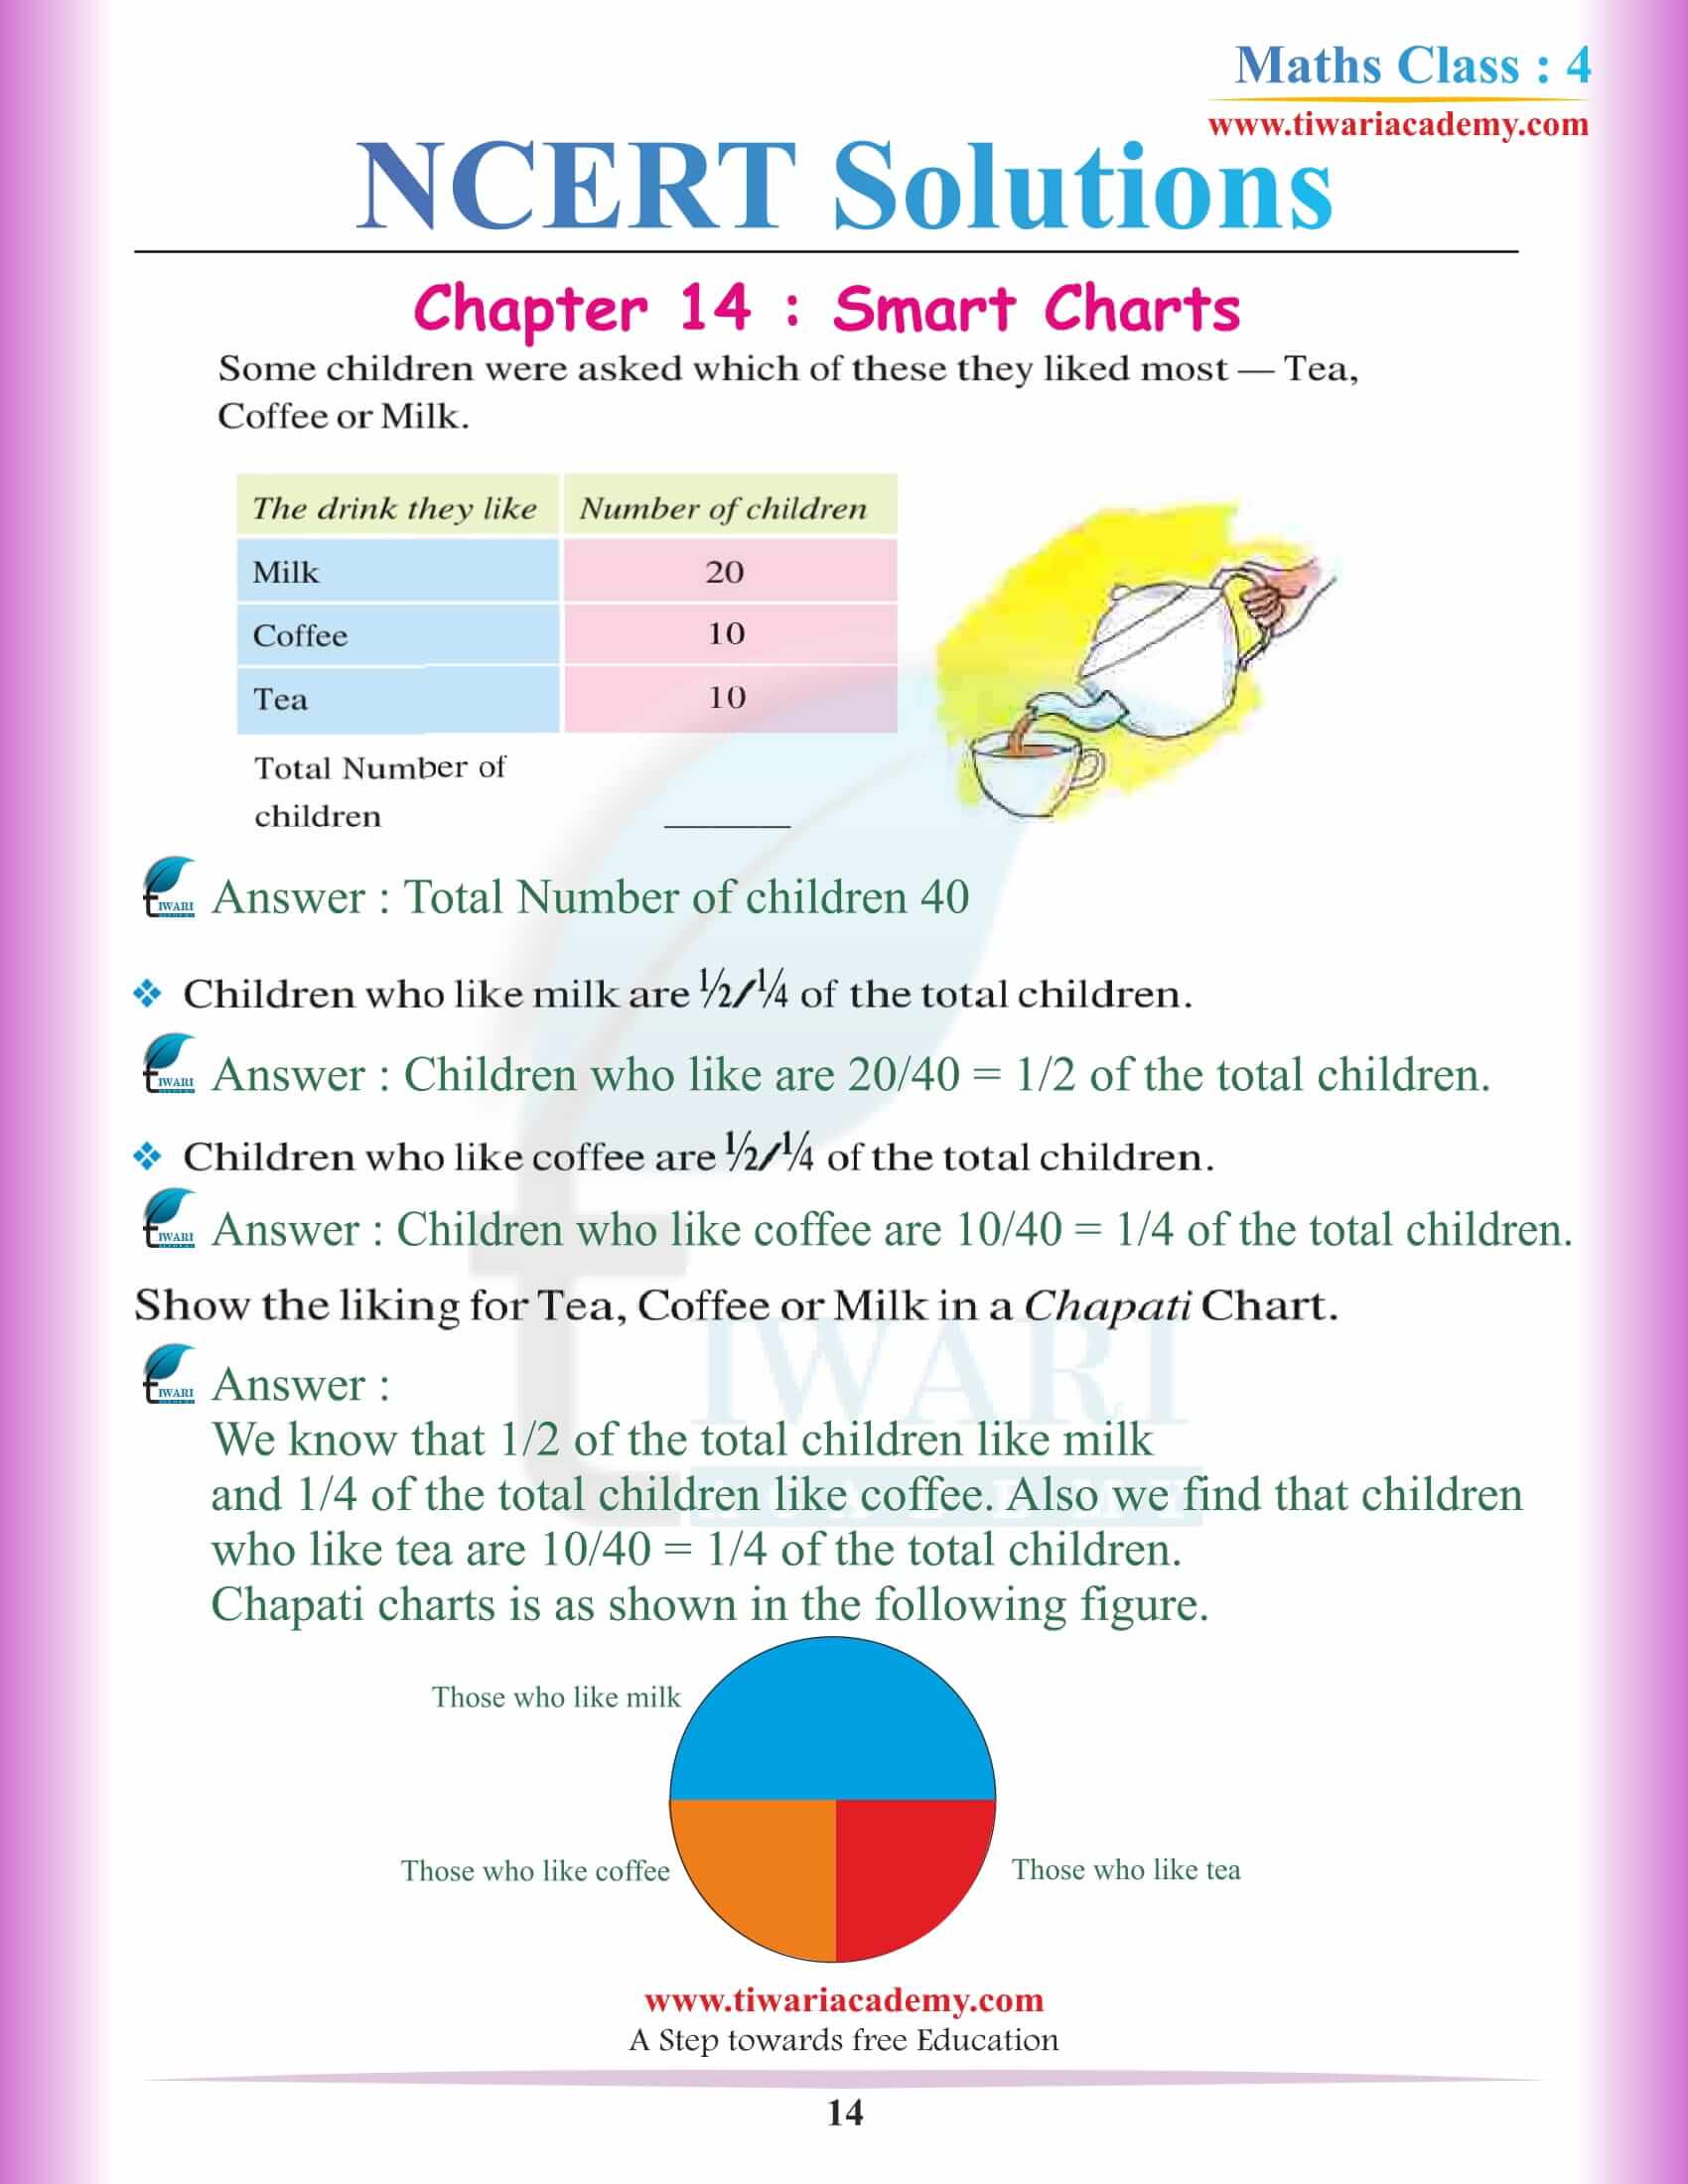
Chapter 14 Smart Charts Solutions
Introduction to Data Handling in Class 4 Maths Mela Chapter 14
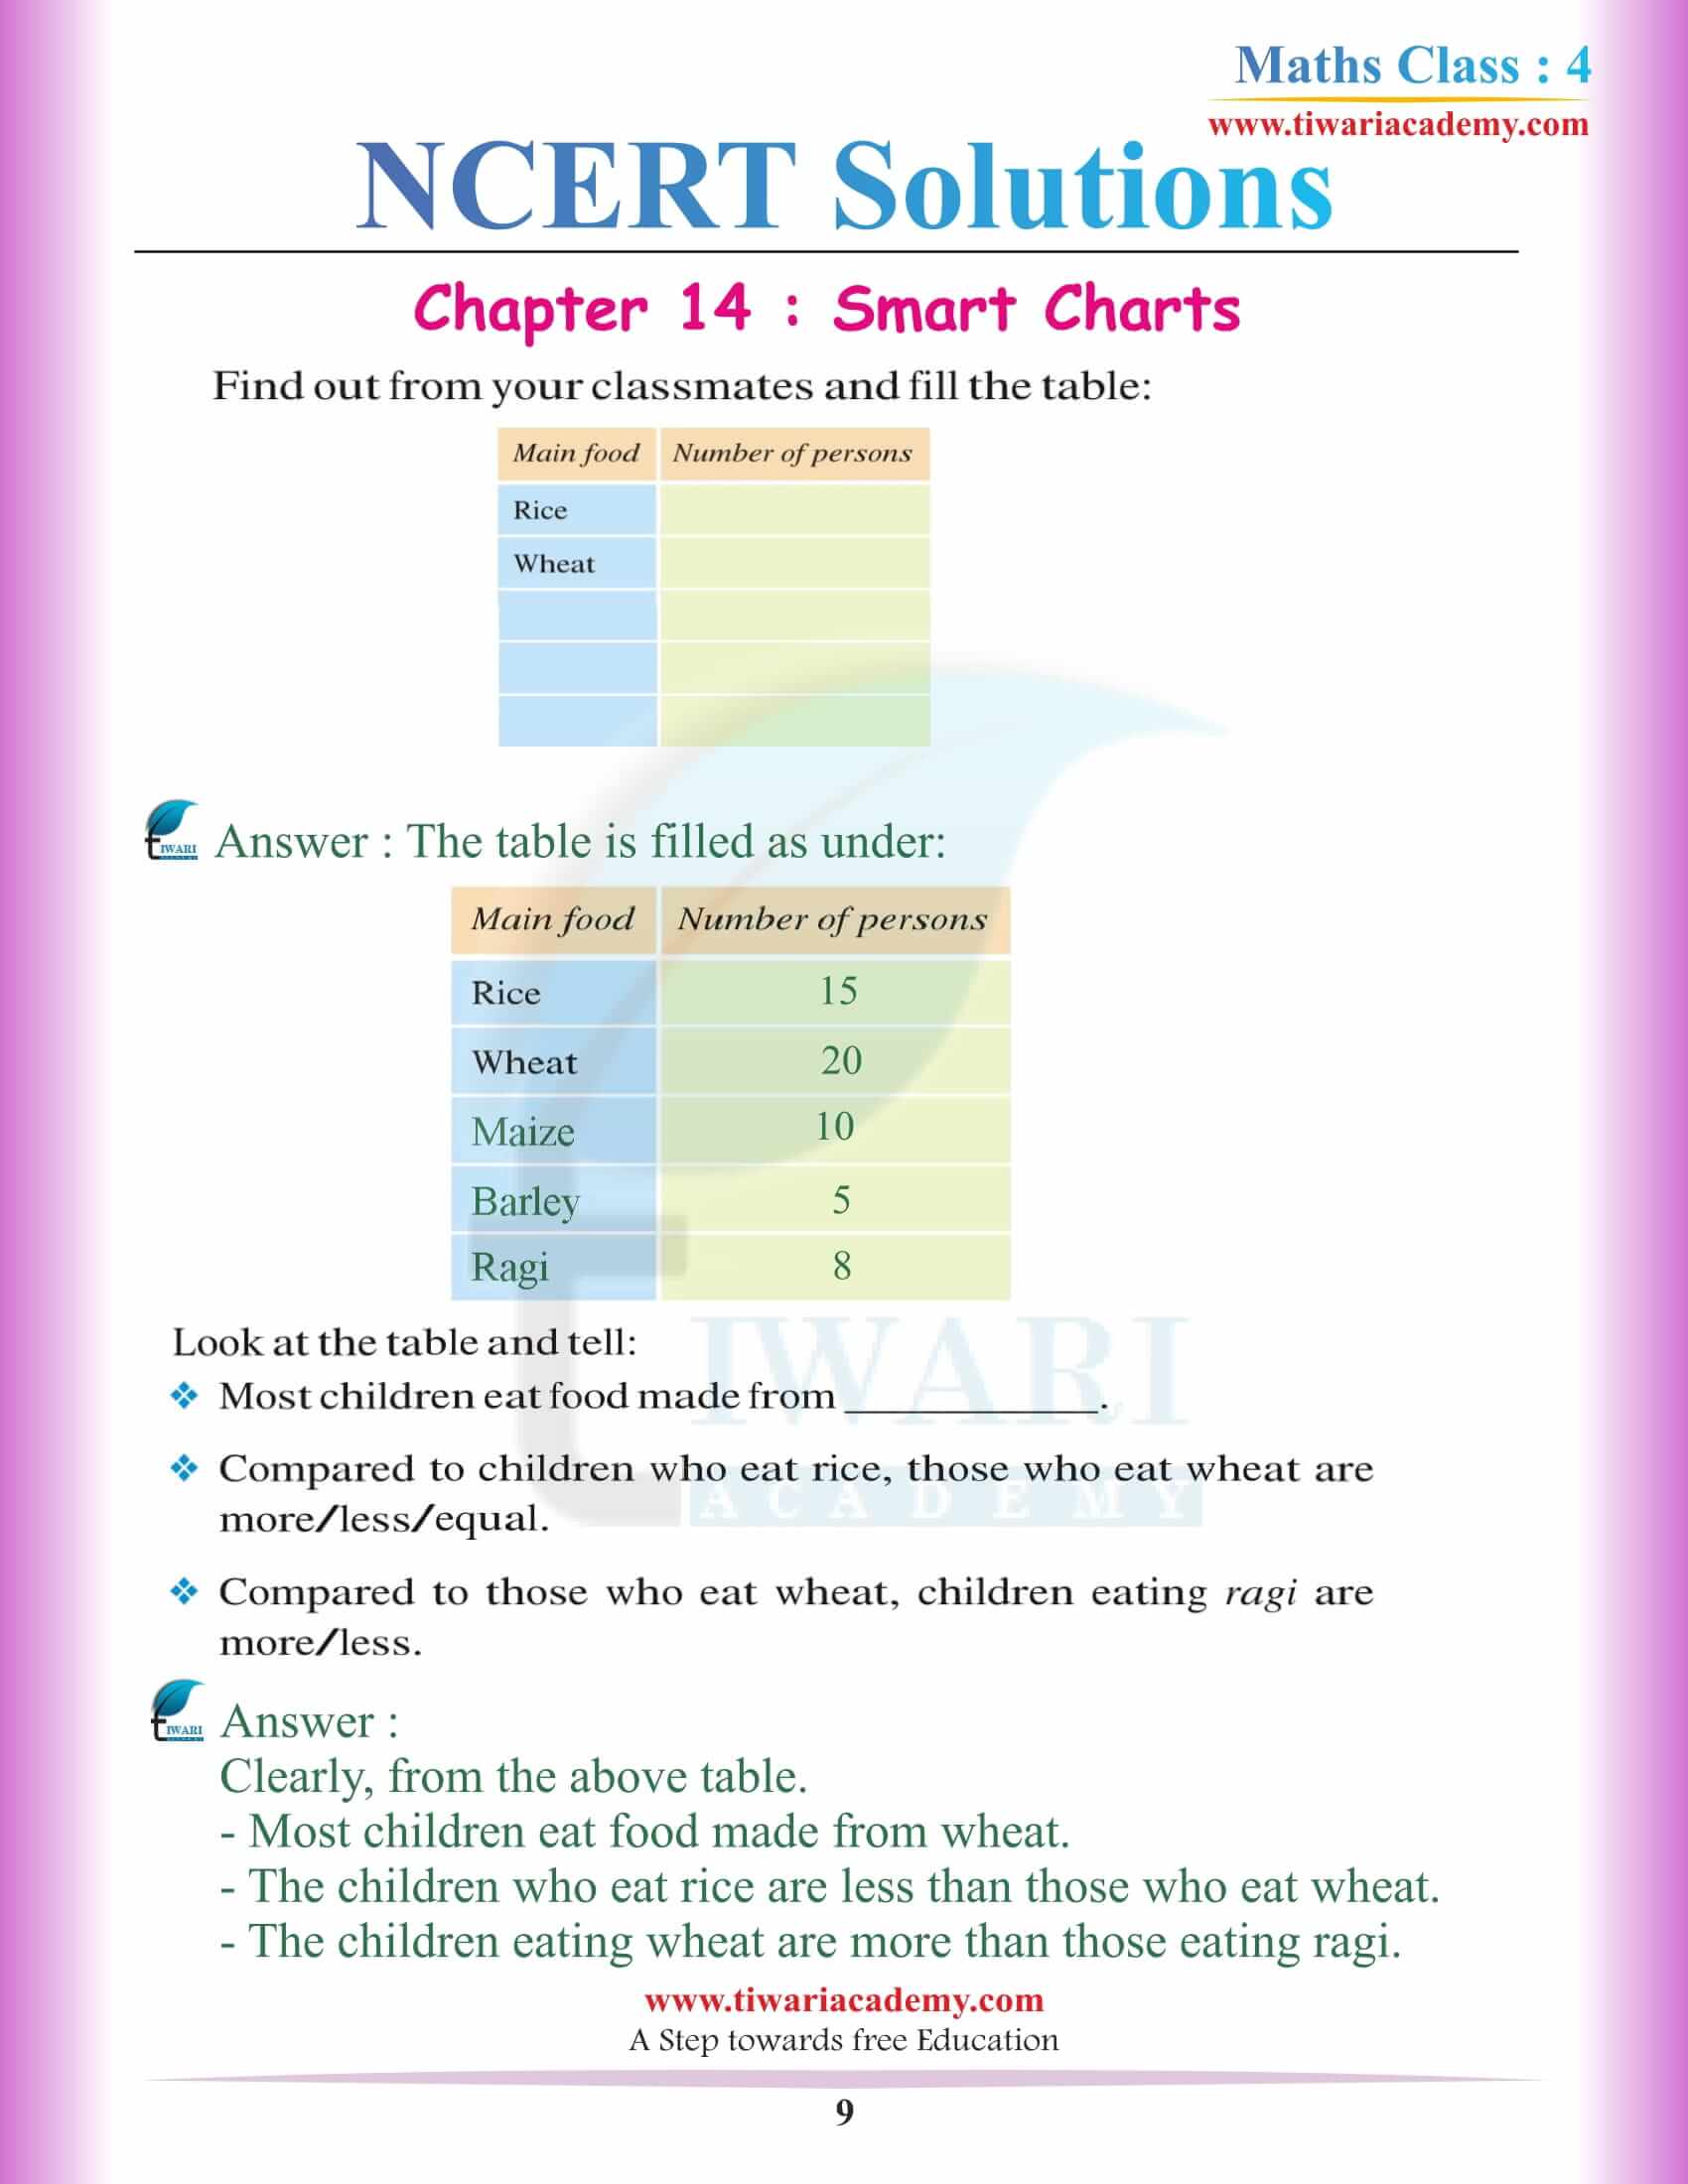
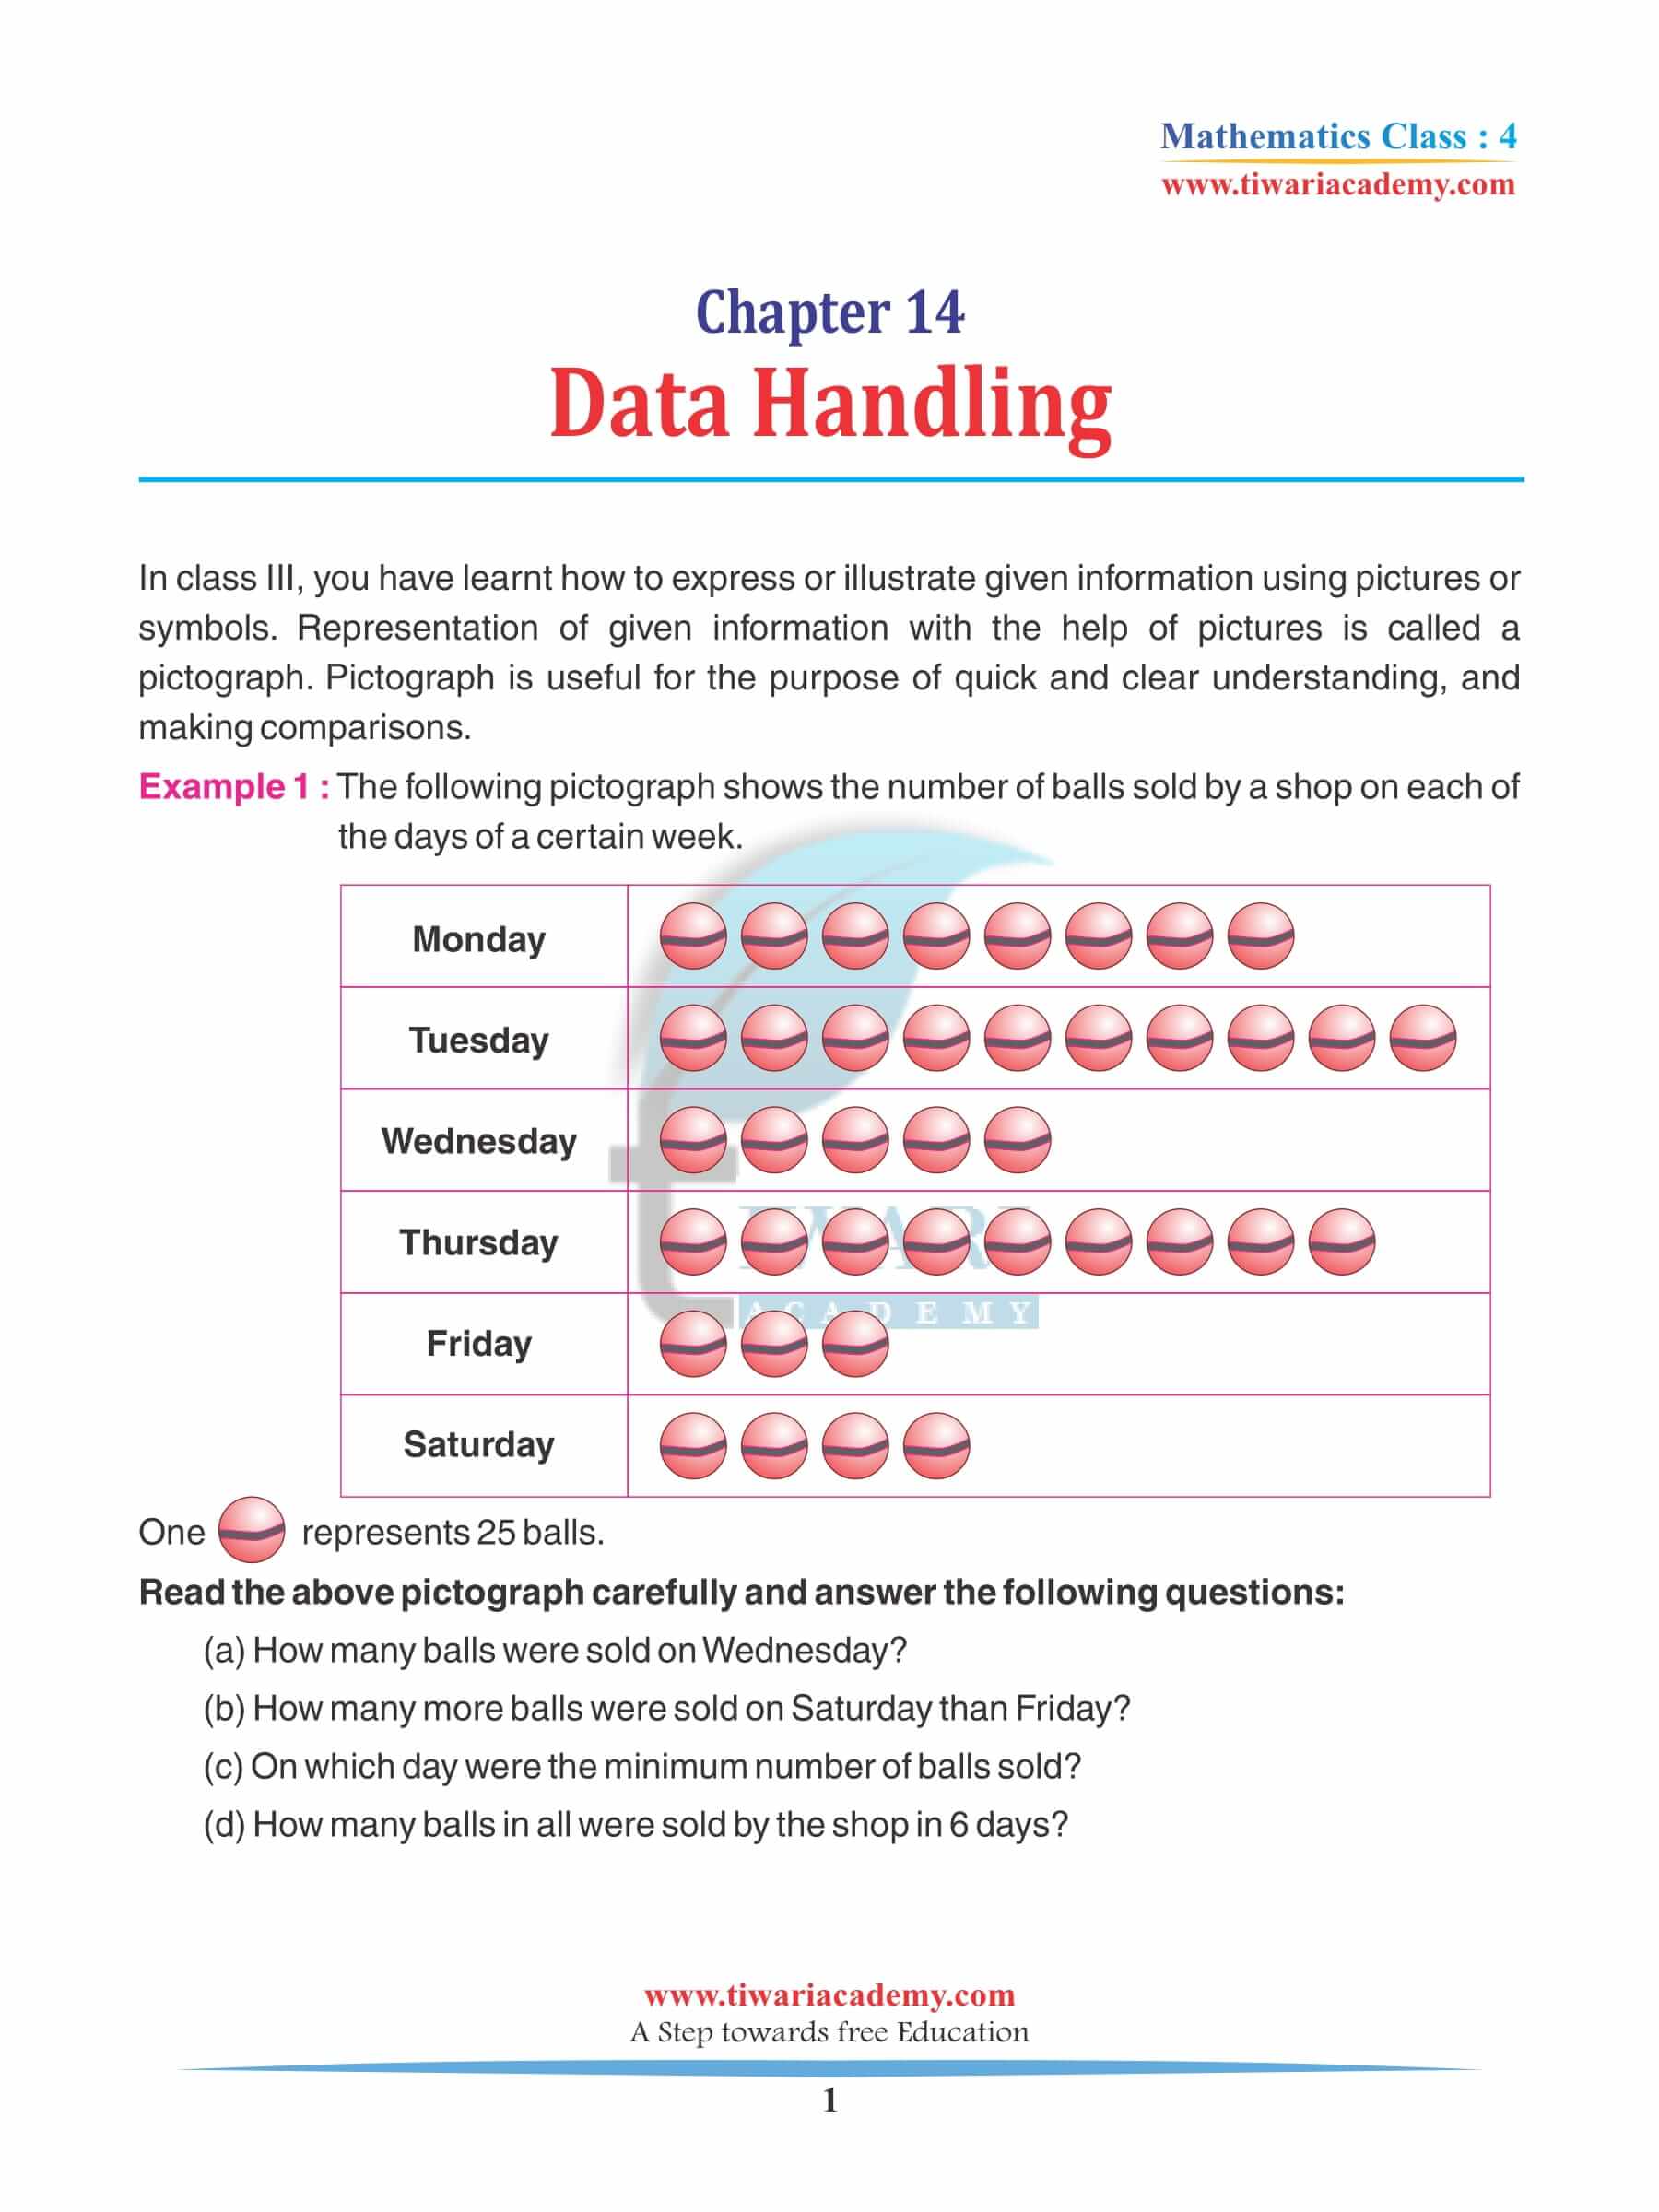
Page 203
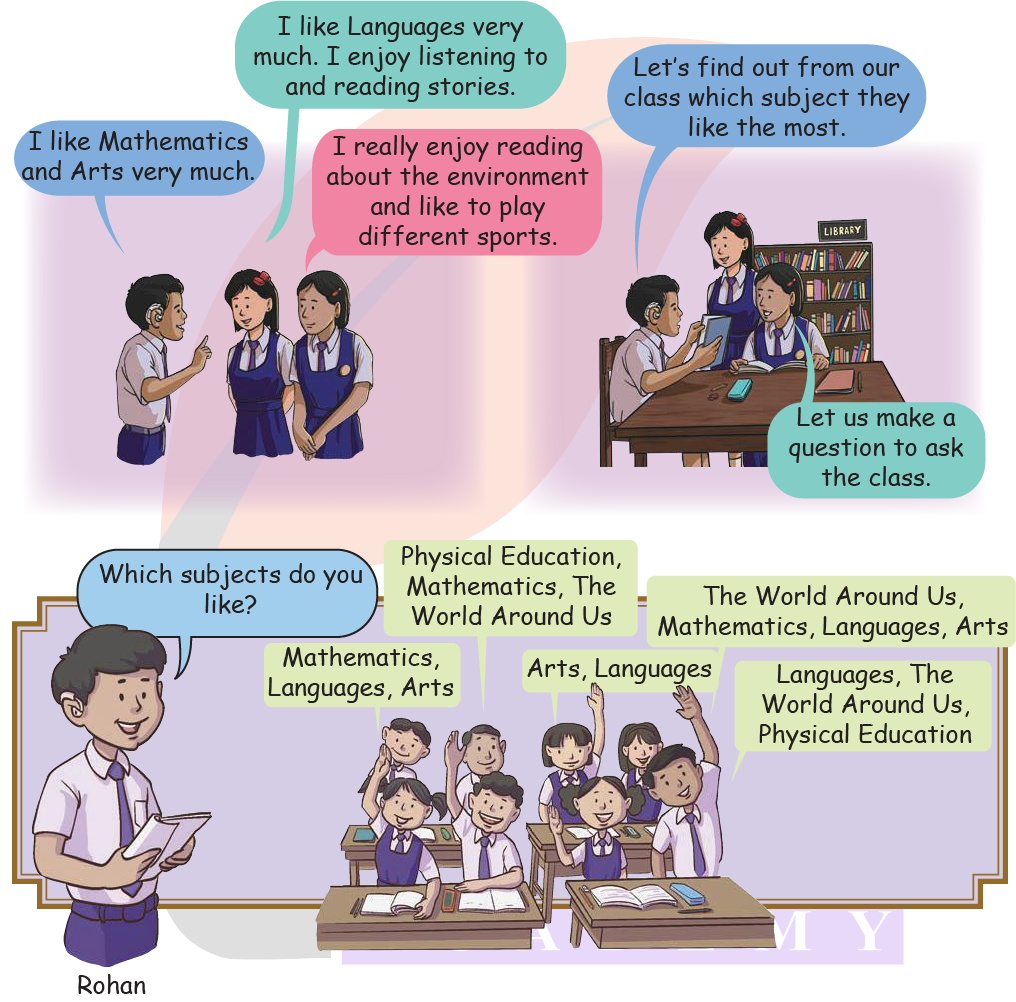
Look at the questions asked by Rohan and Anjali.
Tick the question that is the most appropriate for finding the ‘most liked subject’? Why do you think so? Discuss with your friends and teacher.
Answer:
This is the most appropriate question because:
► This question asks only one clear choice from each student.
► Every child gives one favourite subject, so answers can be counted easily.
► When everyone chooses just one subject, we can compare numbers and find which subject is liked by the maximum number of children.
► Other questions like “Which subjects do you like?” allow many answers, which makes it confusing to decide the most liked subject.
To find “the most”, the question must:
► Be clear
► Ask for one option only
► Give answers that are easy to count and compare
That’s why “Which subject do you like the most?” is the best question to ask.
Page 204
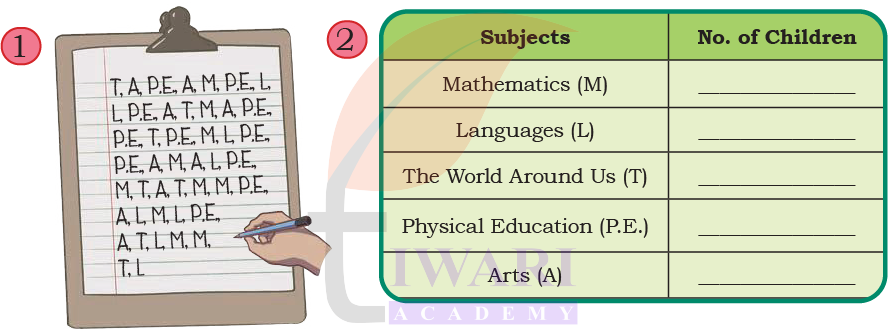
Anjali and Rohan recorded the children’s answers (responses) to the question as follows:
They wrote M for Mathematics, L for Languages, T for The World Around Us, A for Arts and P.E. for Physical Education.
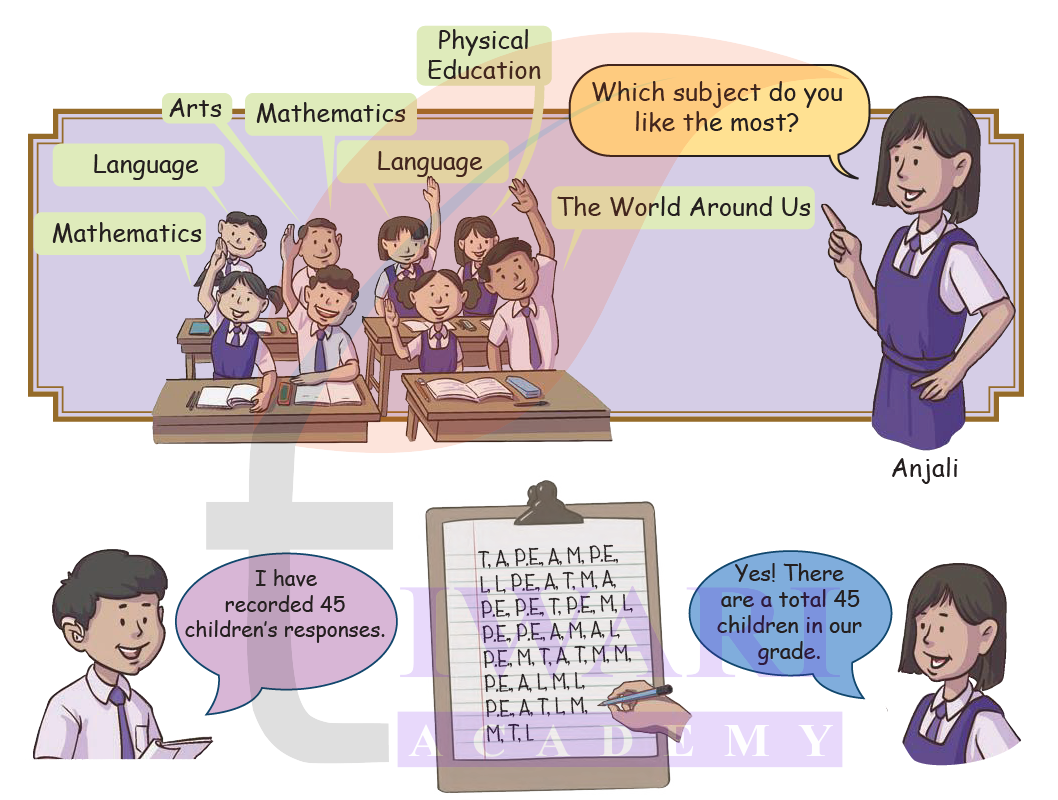
Look at the children’s responses above and answer the following questions:
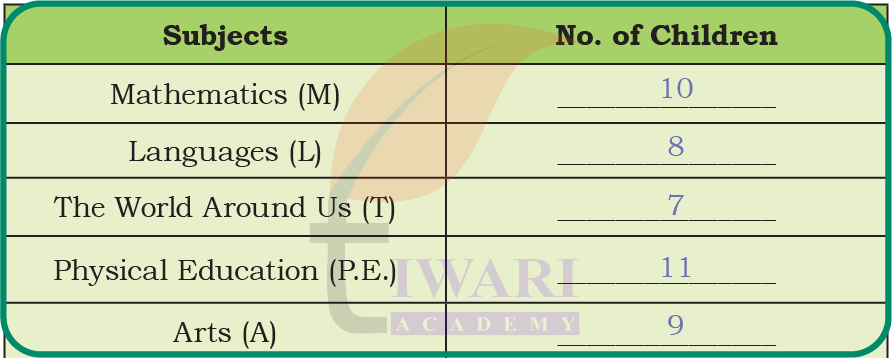
The number of children who like Mathematics the most is ________ .
The number of children who like Language the most is ________ .
The number of children who like The World Around Us the most is ________ .
The number of children who like Physical Education the most is ________ .
The number of children who like Arts the most ________ .
Answer:
The number of children who like Mathematics the most is 10.
The number of children who like Language the most is 8.
The number of children who like The World Around Us the most is 7.
The number of children who like Physical Education the most is 11.
The number of children who like Arts the most 9.
Page 205
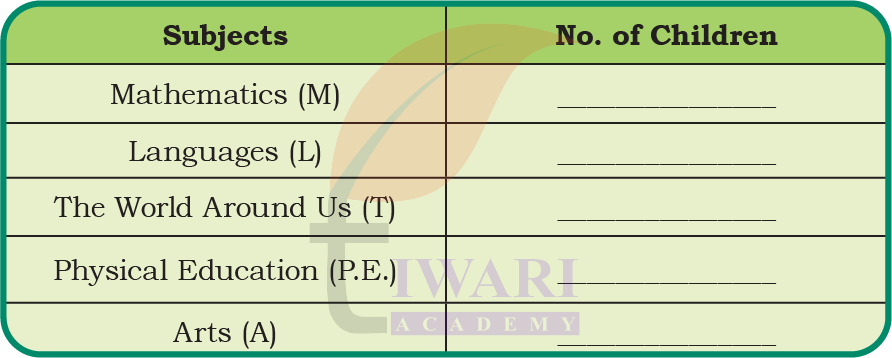
Let’s fill the above information in this table.
Now look at the above table and answer the following questions:
What is the most common favourite subject among the children? ___________
What is the least common favourite subject among the children? ___________
Answer:
The most common favourite subject among the children is “Mathematics”.
The least common favourite subject among the children is “The World Around Us”.
Favourite Subject Activity Explained – Class 4 Maths Mela Chapter 14
Page 205
There are the following two ways to display the information.
Which way of displaying information is easier to understand and why?
Answer:
The table format (option 2) is easier to understand because it organizes the data clearly, showing the count for each subject at a glance, rather than having to count through a long list of letters.
Page 206
Colourful Golas
During school lunch break children rush to eat gola of their favourite colour.
Rohan and Anjali record the golas eaten by different children. They want to eat the one that is most eaten by others.
They both start recording the golas eaten by the children.
Look at the information given above. Colour the line drawing of the golas appropriately.
1. Which colour ice gola do the children eat:
a) the most
b) the least
How do you know?
Answer:
a) yellow
b) blue
We can know which ice gola eaten least or most by counting the number of ice golas of each color which is given on the provided image.
Yellow has the highest count (10), so it is the most popular among the children.
2. Which colour gola would Anjali and Rohan have bought?
Answer:
Anjali and Rohan want to eat the one that is most eaten by others.
Since the most eaten gola is yellow, so they have bought yellow gola.
3. Which color golas did boys eat the most?
Answer:
As per the image boys eaten yellow gola most. Boys had 6 gola.
4. Which colour golas did girls eat the most?
Answer:
Girls have eaten most Red, Orange, Yellow. Girls eaten 4 each of those colours.
5. Which of the ways of representing data did you use to answer these questions and why?
Answer:
I used the pictorial representation (pictures/pictograph) to answer these questions.
Because the data is shown using pictures for boys and girls separately, it is easy to count the pictures and compare them. By looking at the number of pictures for each colour of gola, we can clearly see which colour was eaten the most and the least. Pictures make the information simple, clear and easy to understand.
Page 207
Activity Chess or Cricket
Find out from the class mate how many of them play only chess, only cricket, both or neither.

Answer:
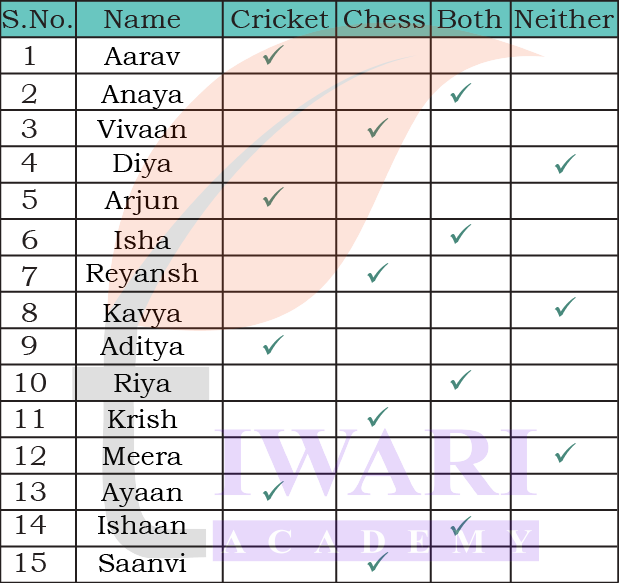
Now let us organise the above data in the table.
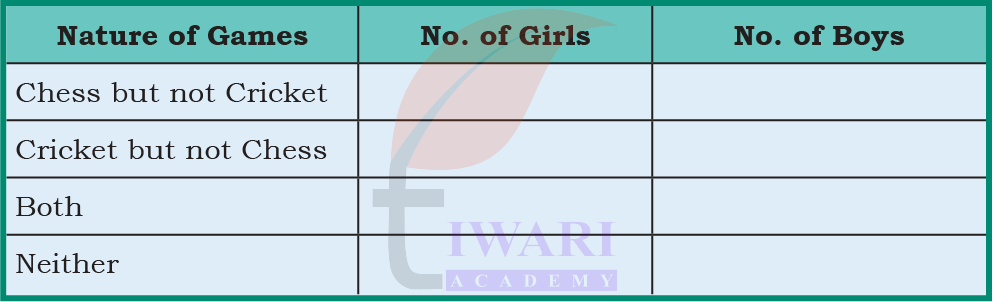
Answer:
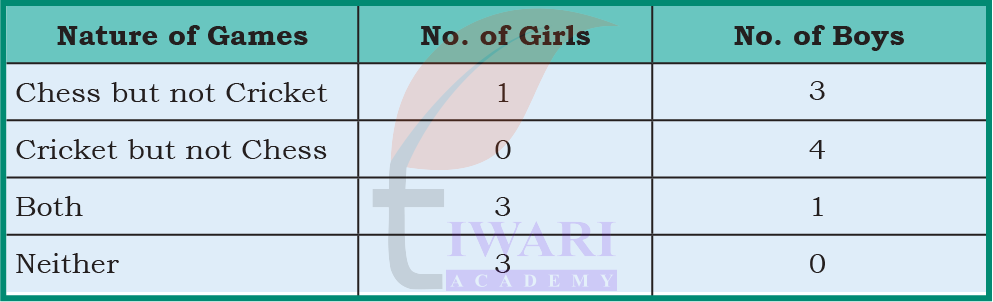
Answer these questions based on the data collected from your grade.
1. Who plays Chess the most? _______ (Boys/Girls)
2. Who plays Cricket the most? _______ (Boys/Girls)
3. How many children play both types of games? _______
Answer:
1. Boys and Girls are same.
Because:
Number of girls playing chess = 1 + 3 = 4
Number of Boys playing chess = 3 + 1 = 4
2. Boys
Because:
Number of girls playing cricket = 3
Number of Boys playing cricket = 4 + 1 = 5
3. 4 children (3 girls + 1 boy).
Page 208
Bal Mela
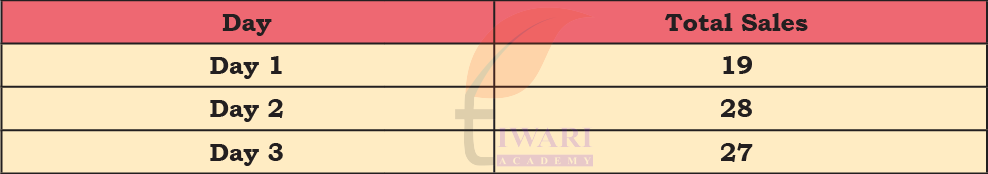
Anjali and Rohan have recorded the number of people who ate fruit chaats and sandwiches in the Bal Mela over three days, using a Pictograph.
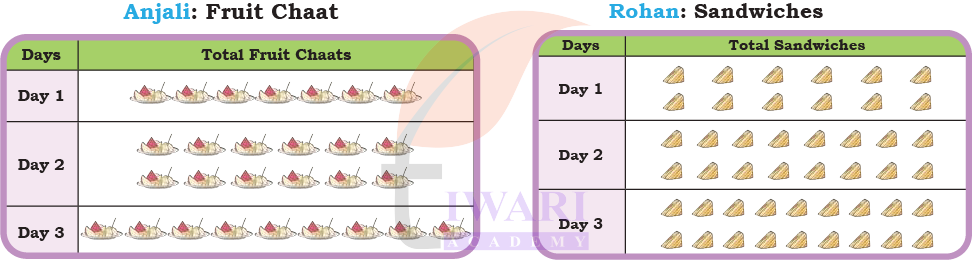
Answer:
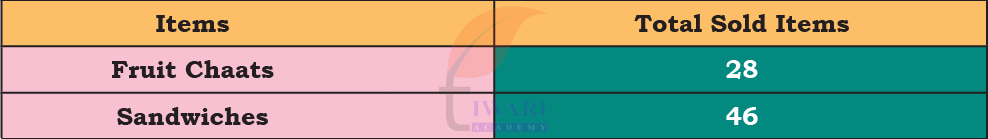
Fruit chaats: 28
Day 1 = 7
Day 2 = 12
Day 3 = 9
Total Fruit chaats sold = 7 + 12 + 9 = 28
Sandwiches: 46
Day 1 = 12
Day 2 = 16
Day 3 = 18
Total sandwiches sold = 12 + 16 + 18 = 46
Page 208
Let Us Do
1. Complete the table.
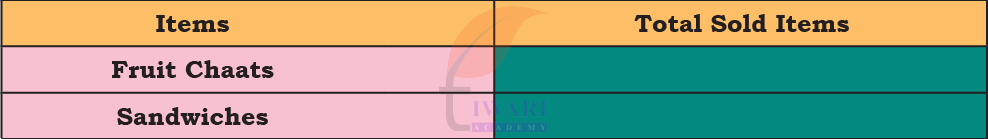
Answer:
2. On which day were the most sandwiches sold?
Answer:
On day 3 most sandwiches sold (18 sandwiches).
3. Which item had the highest sale on Day 2?
Answer:
Day 2: Fruit chaats sale = 12
Day 2: Sandwiches sale = 16
So, Sandwiches had highest day 2 sale.
4. Complete the table given below. Circle the day that had the highest sales.
Answer:
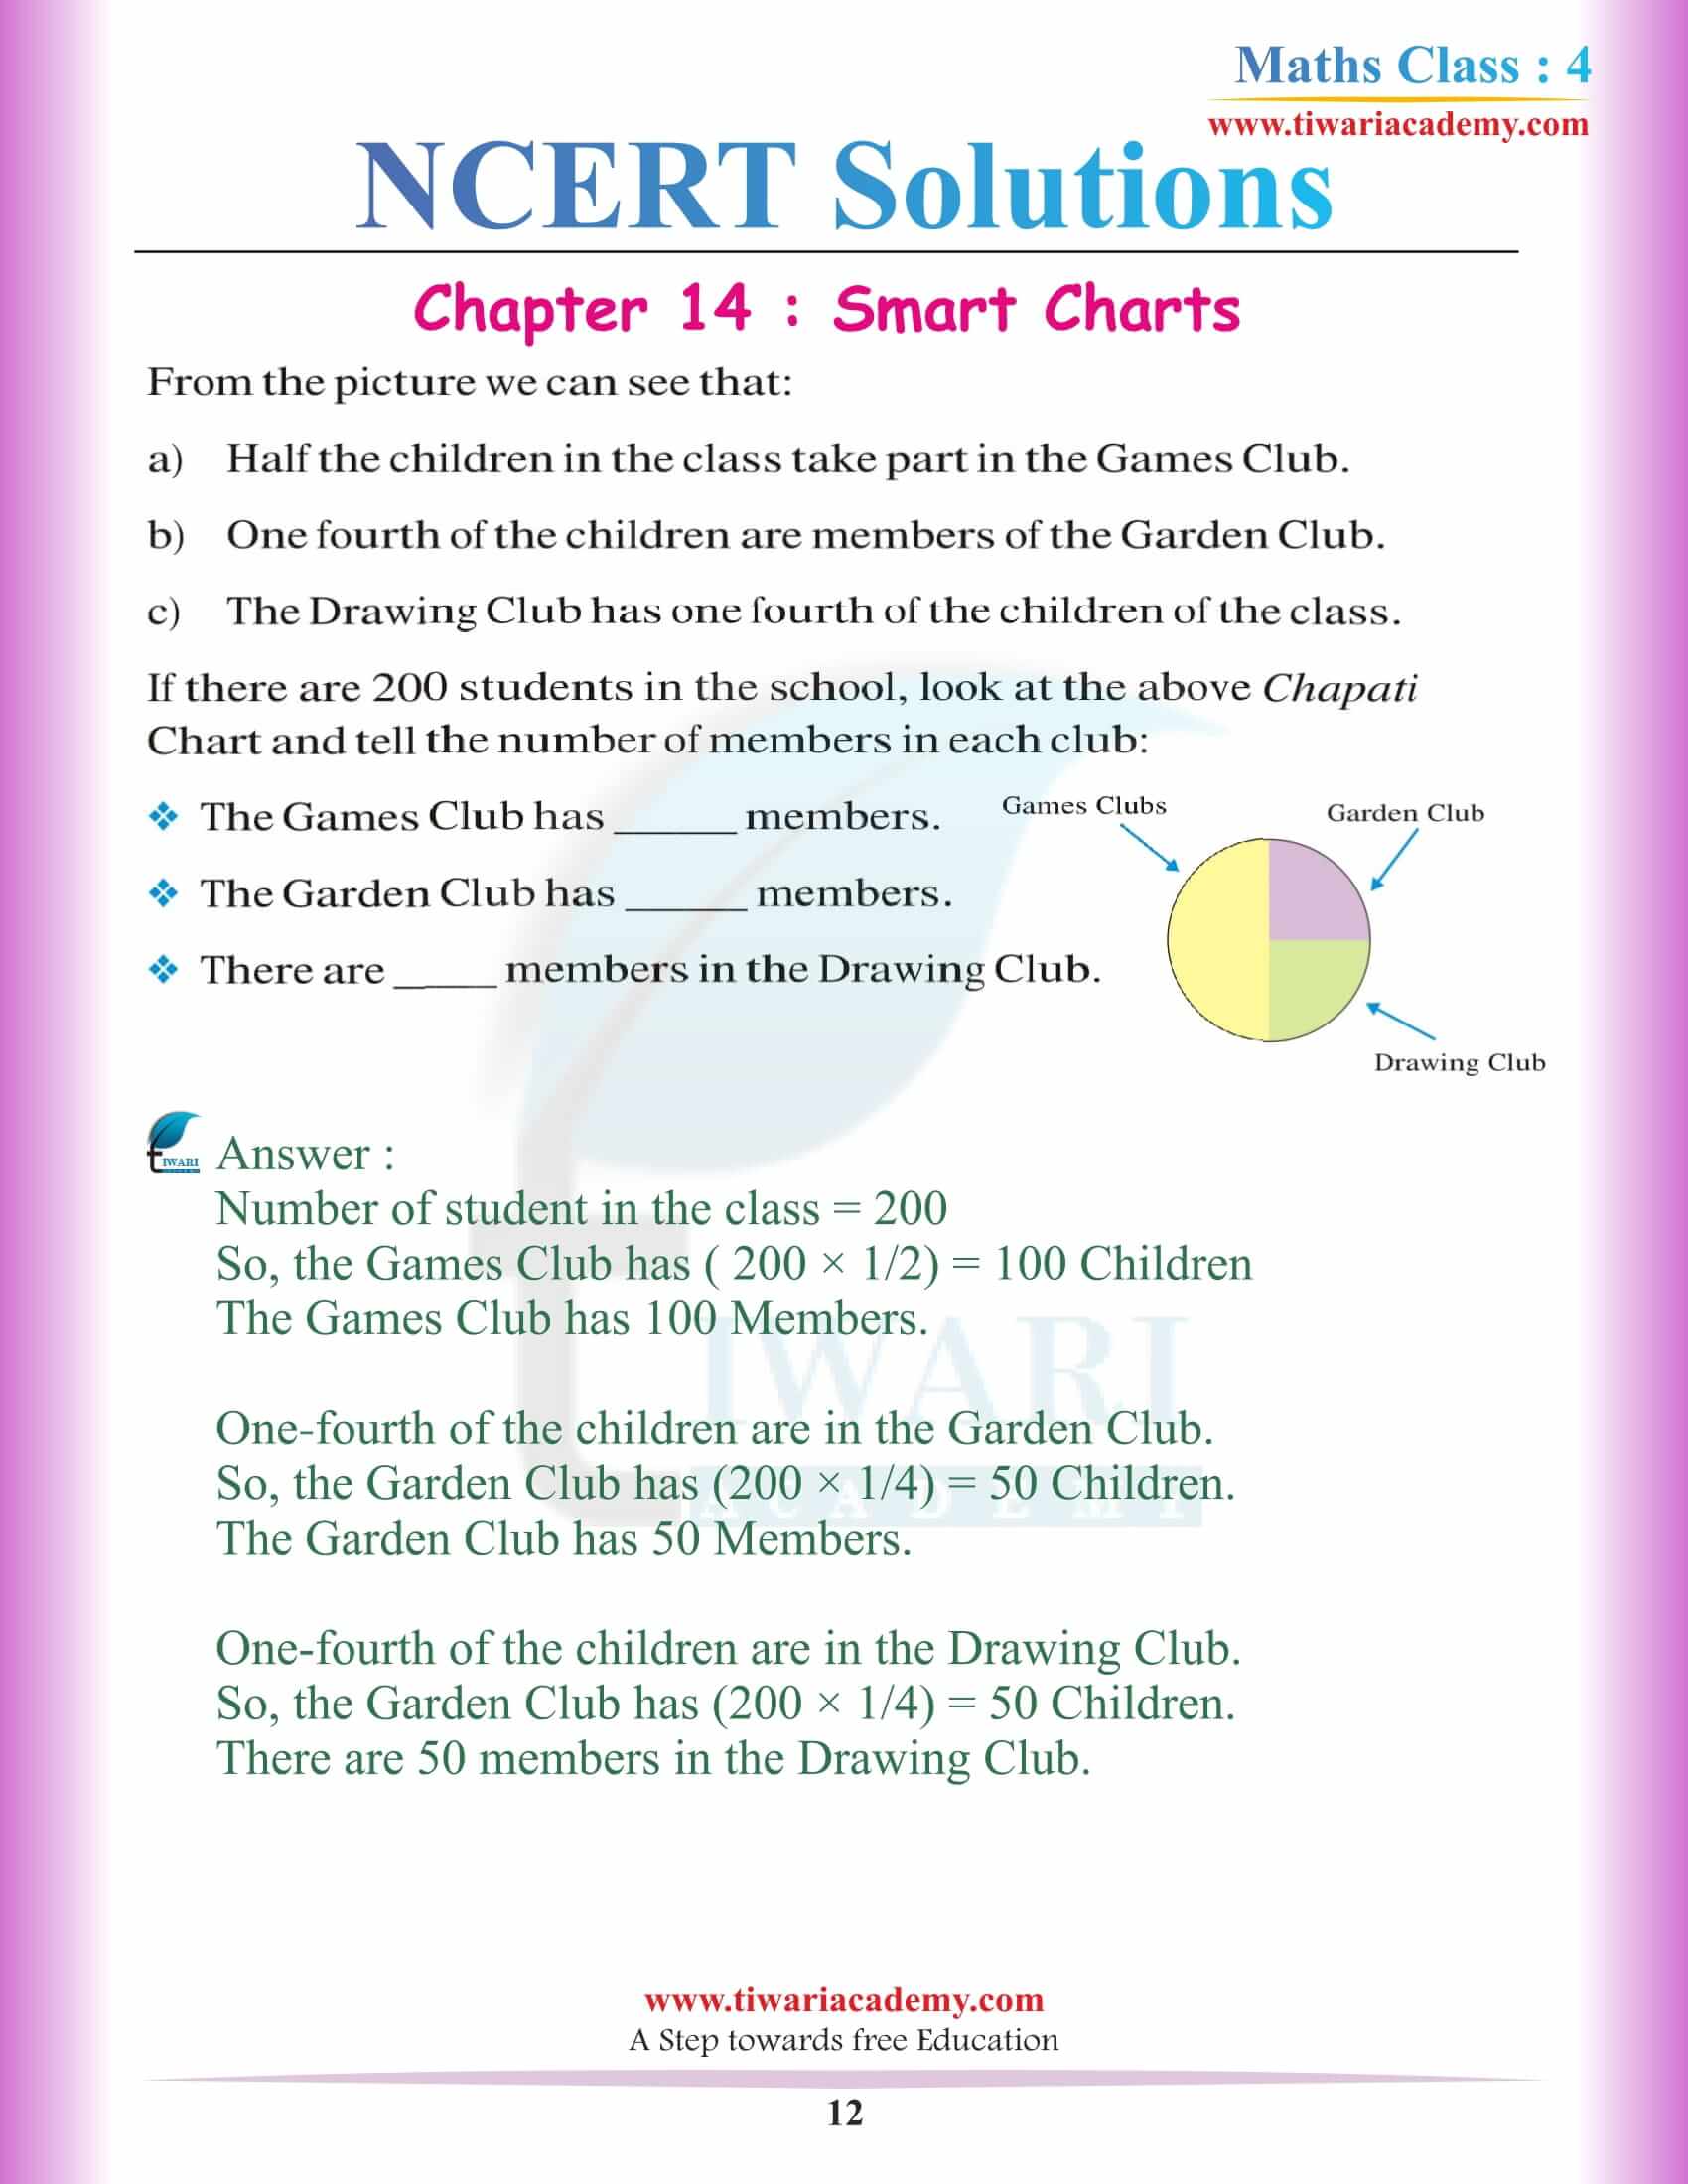
NCERT Solutions for Class 4 Maths Chapter 14 Smart Charts
App for Class 4 NCERT Solutions


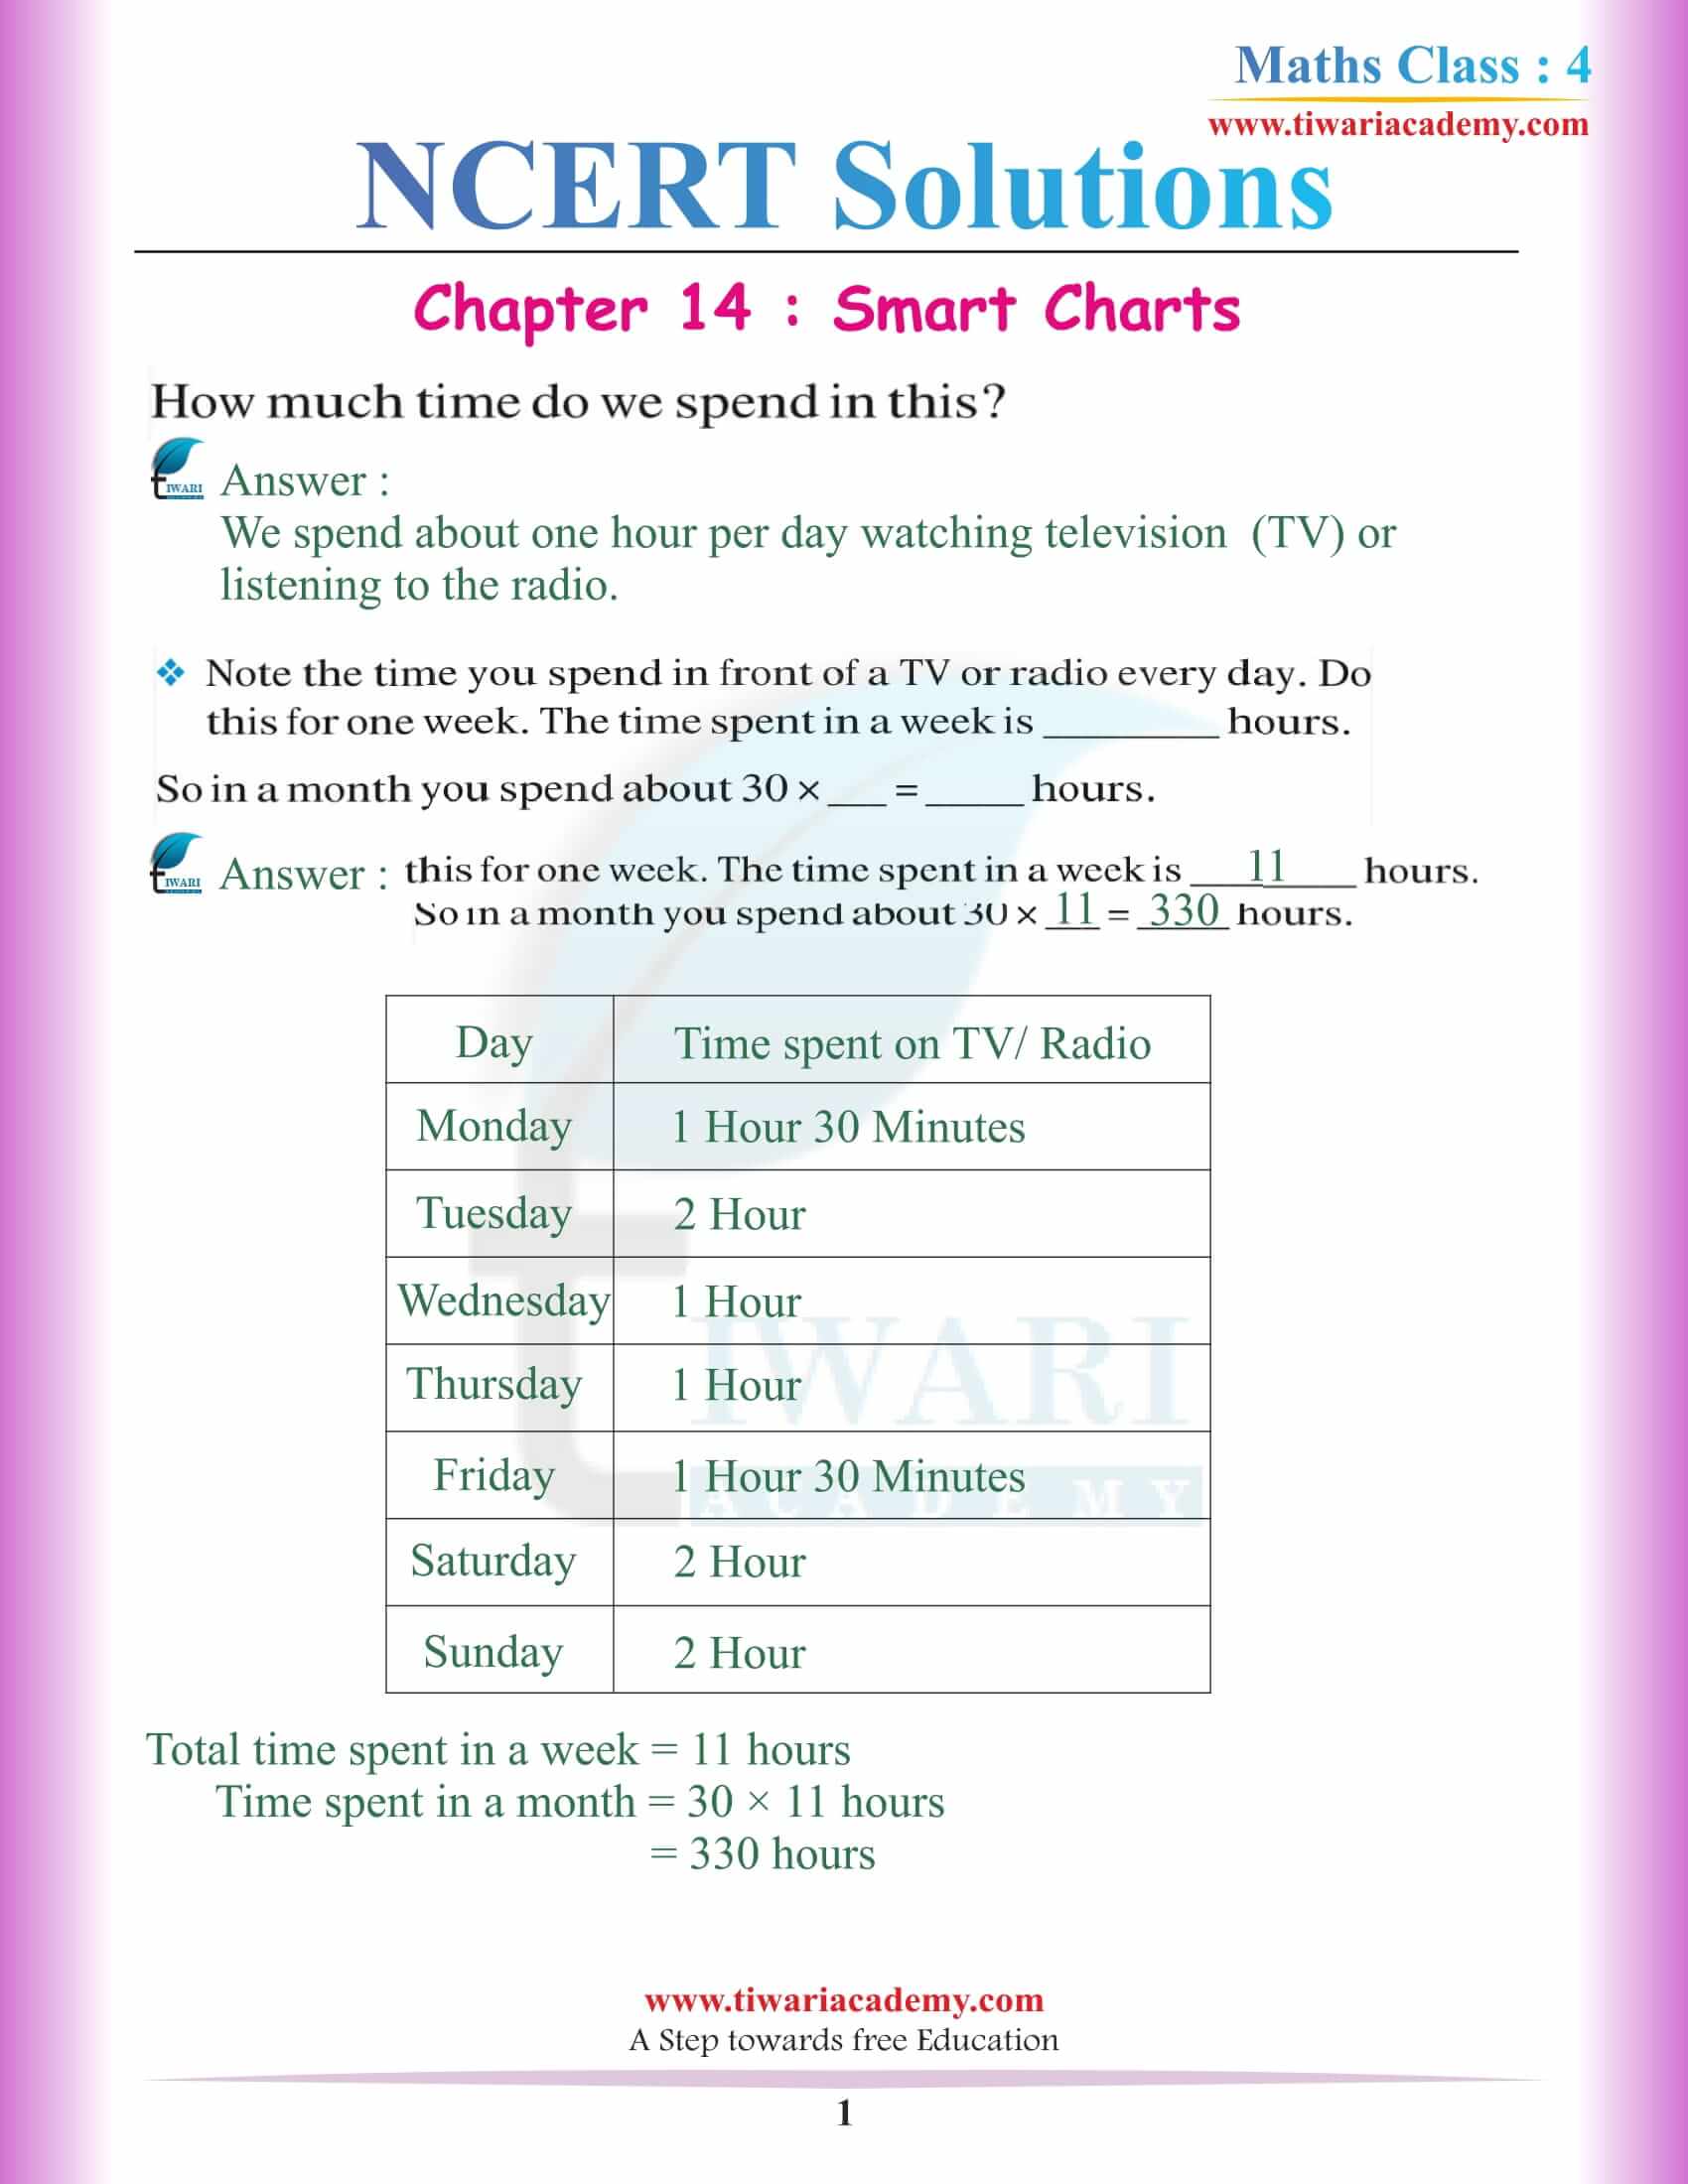
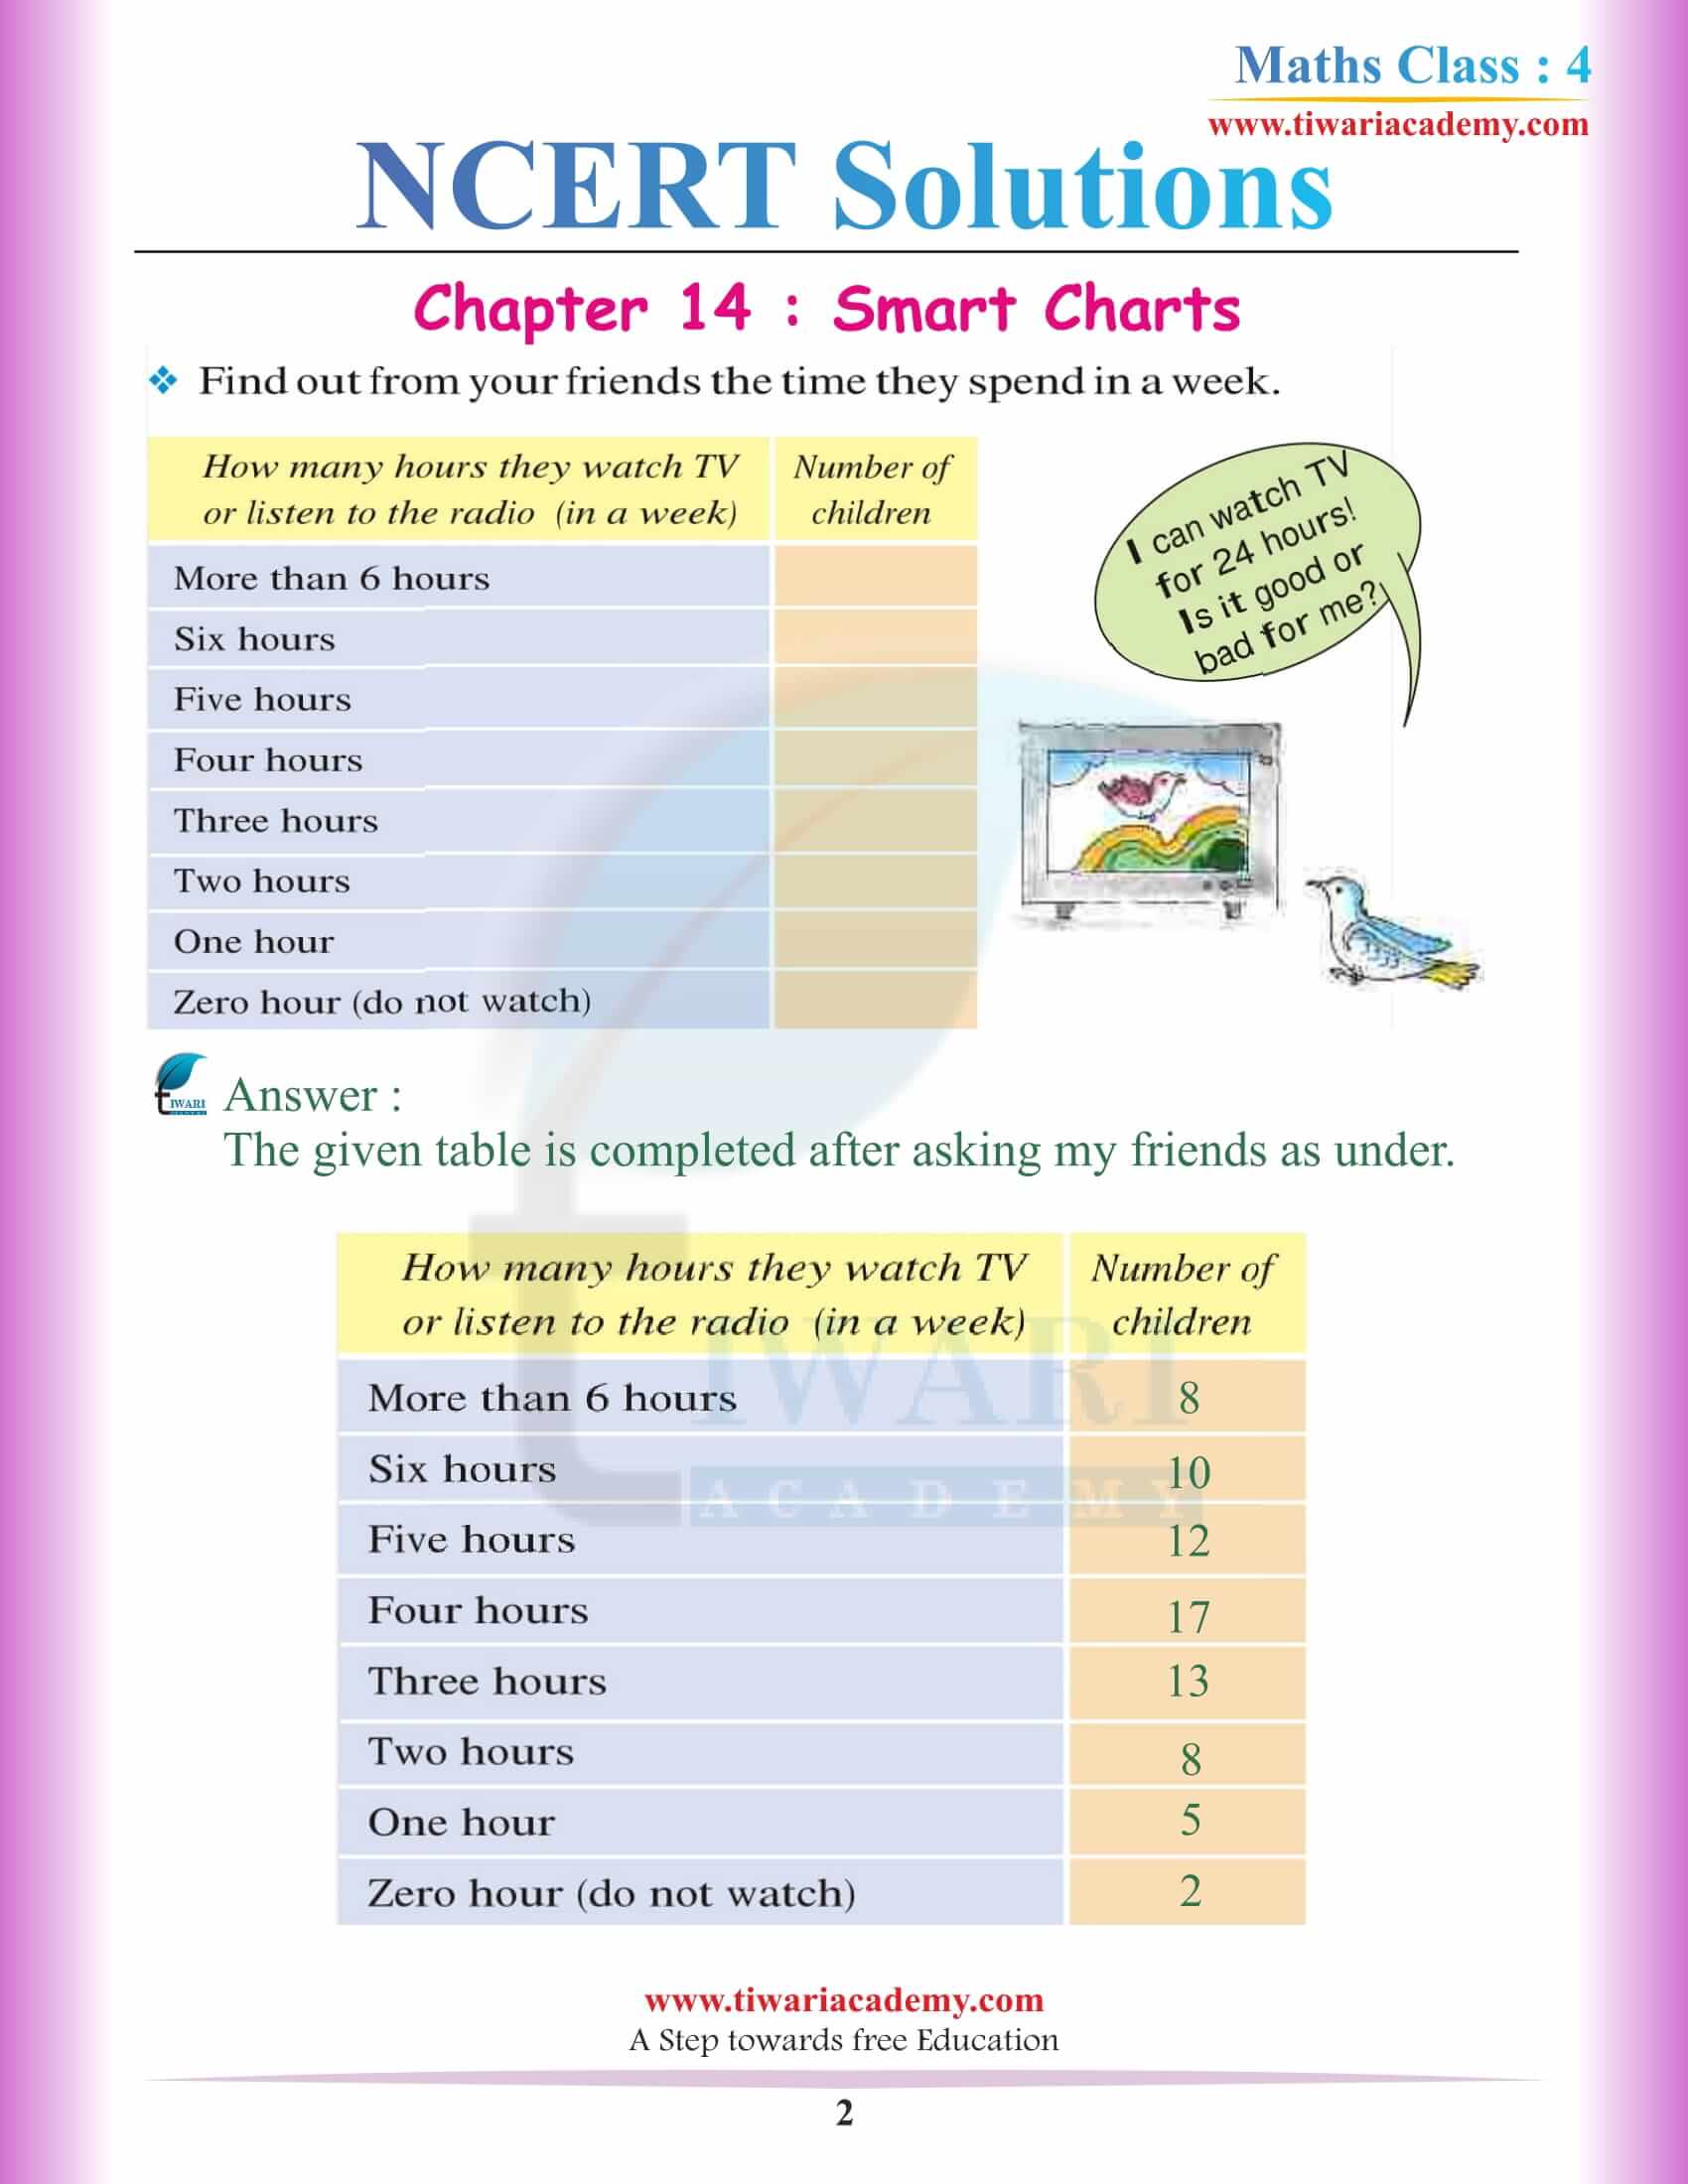
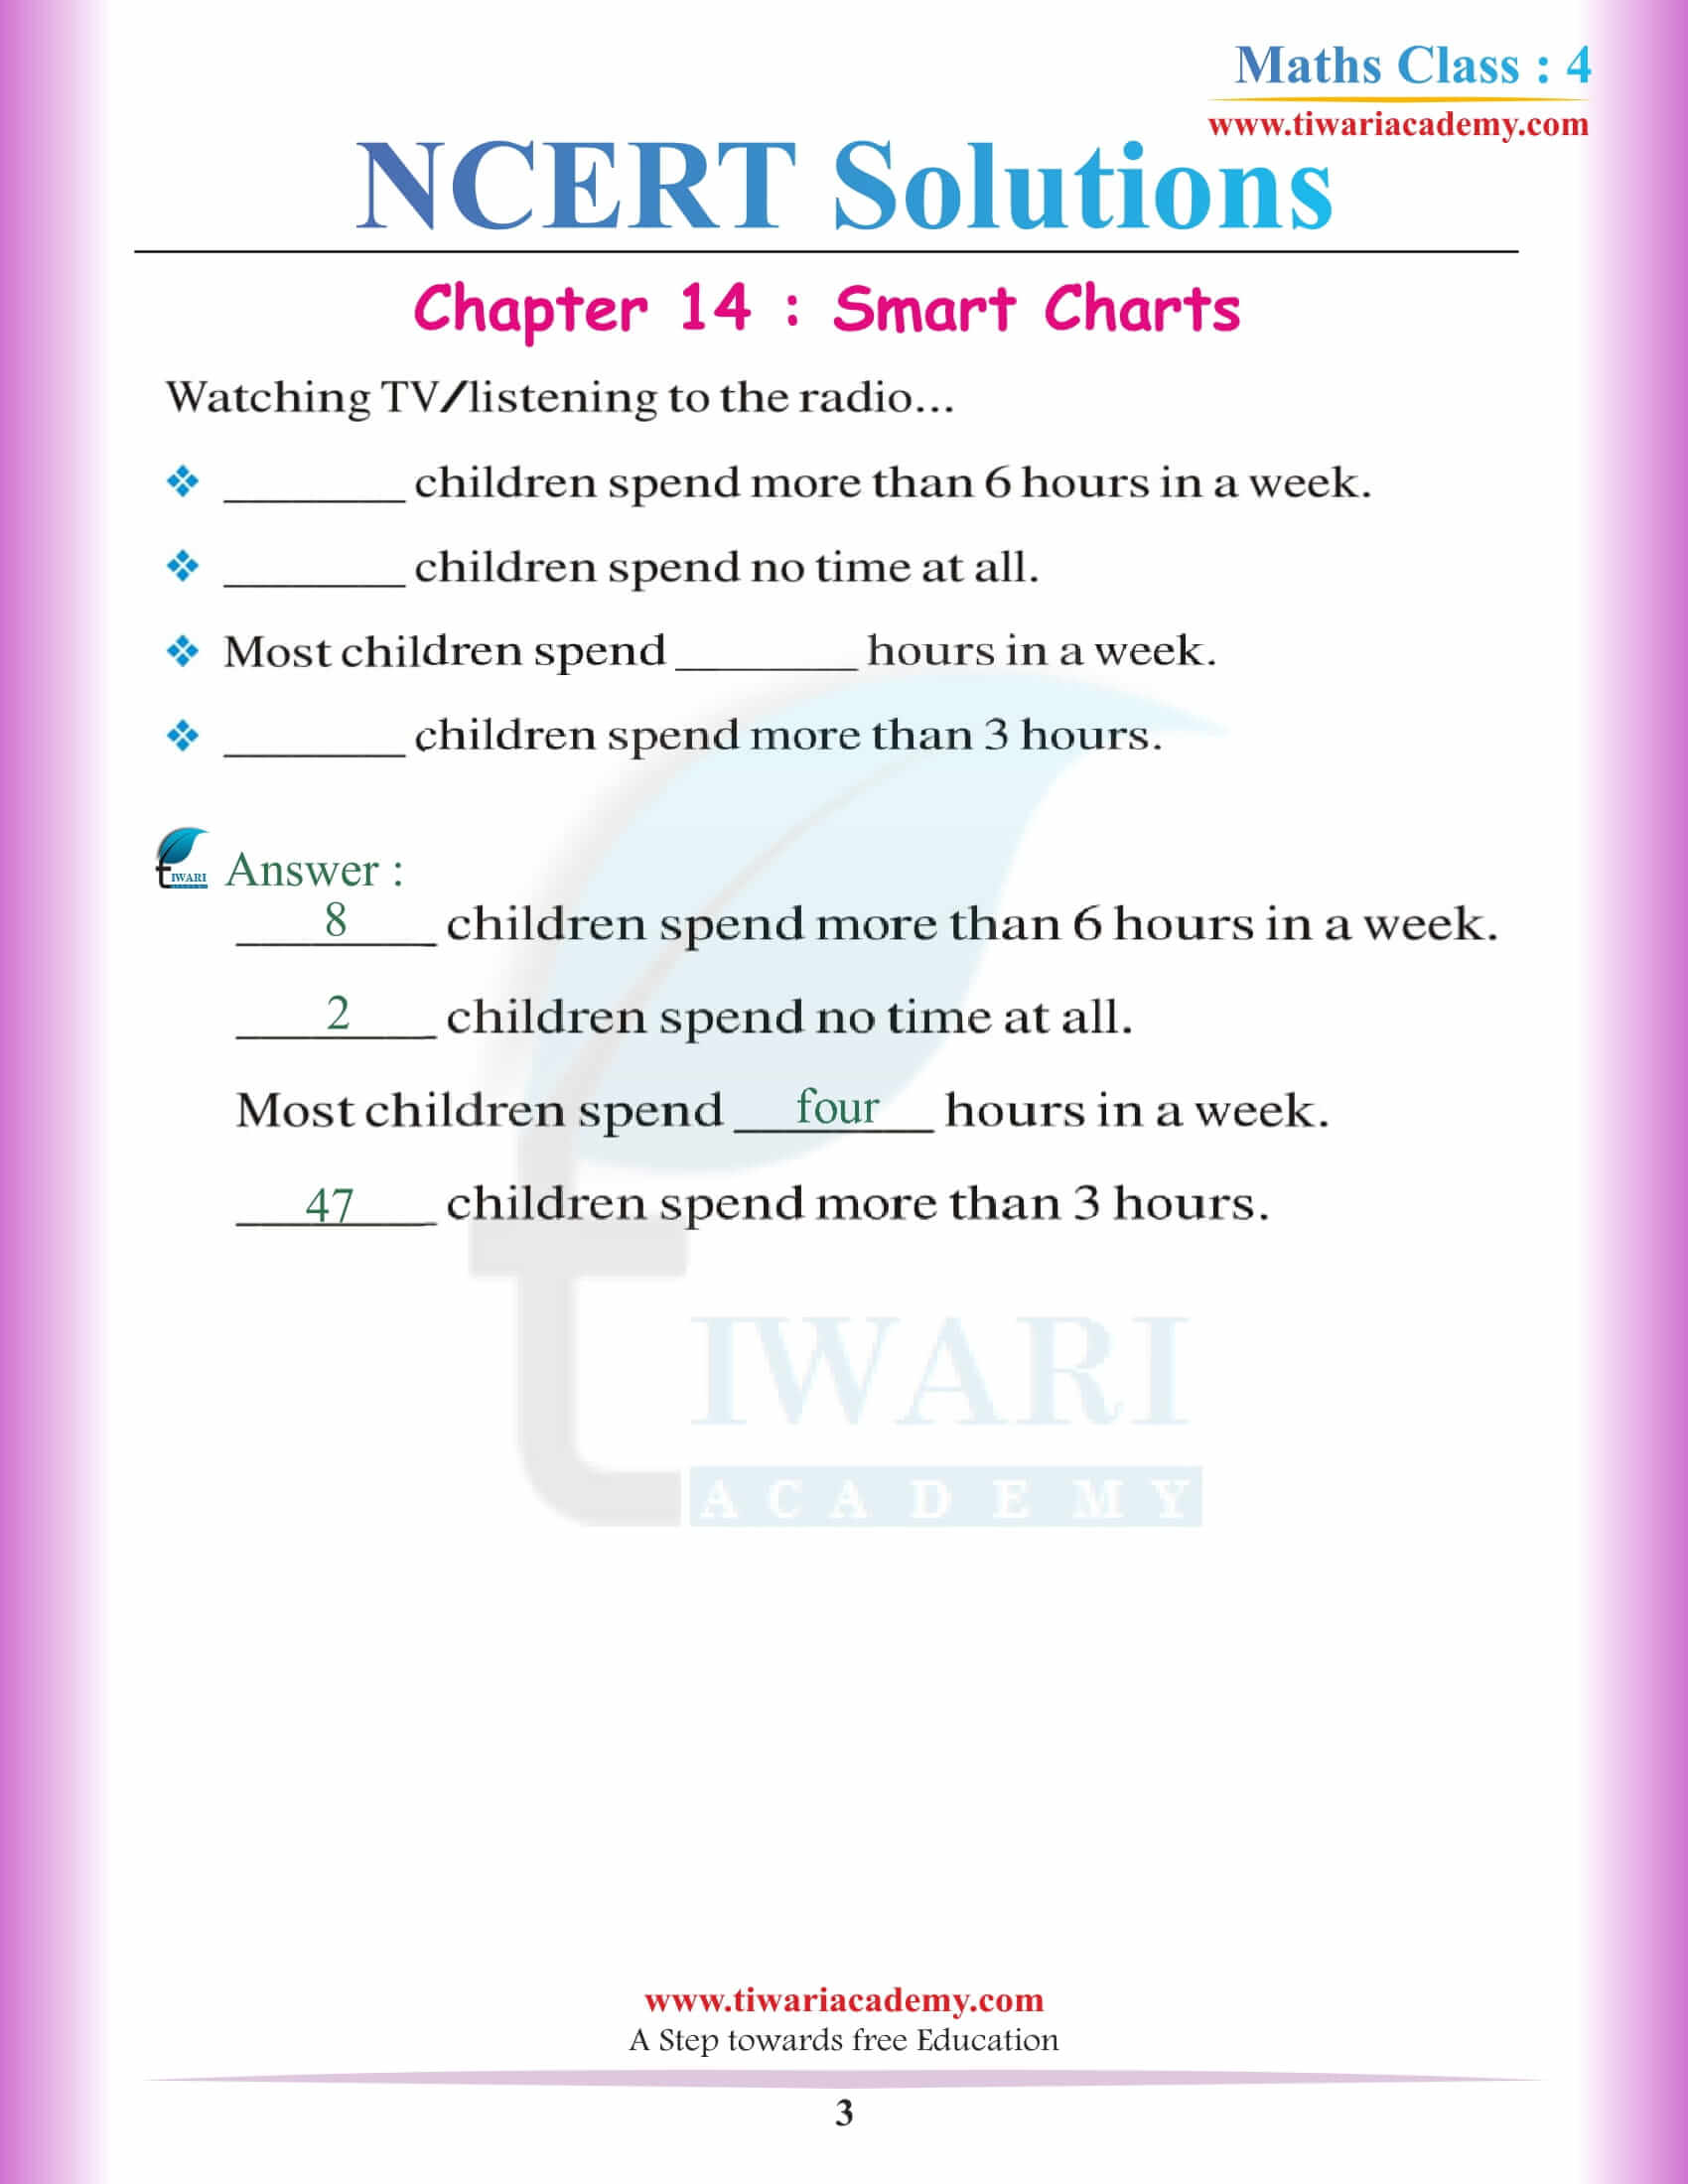
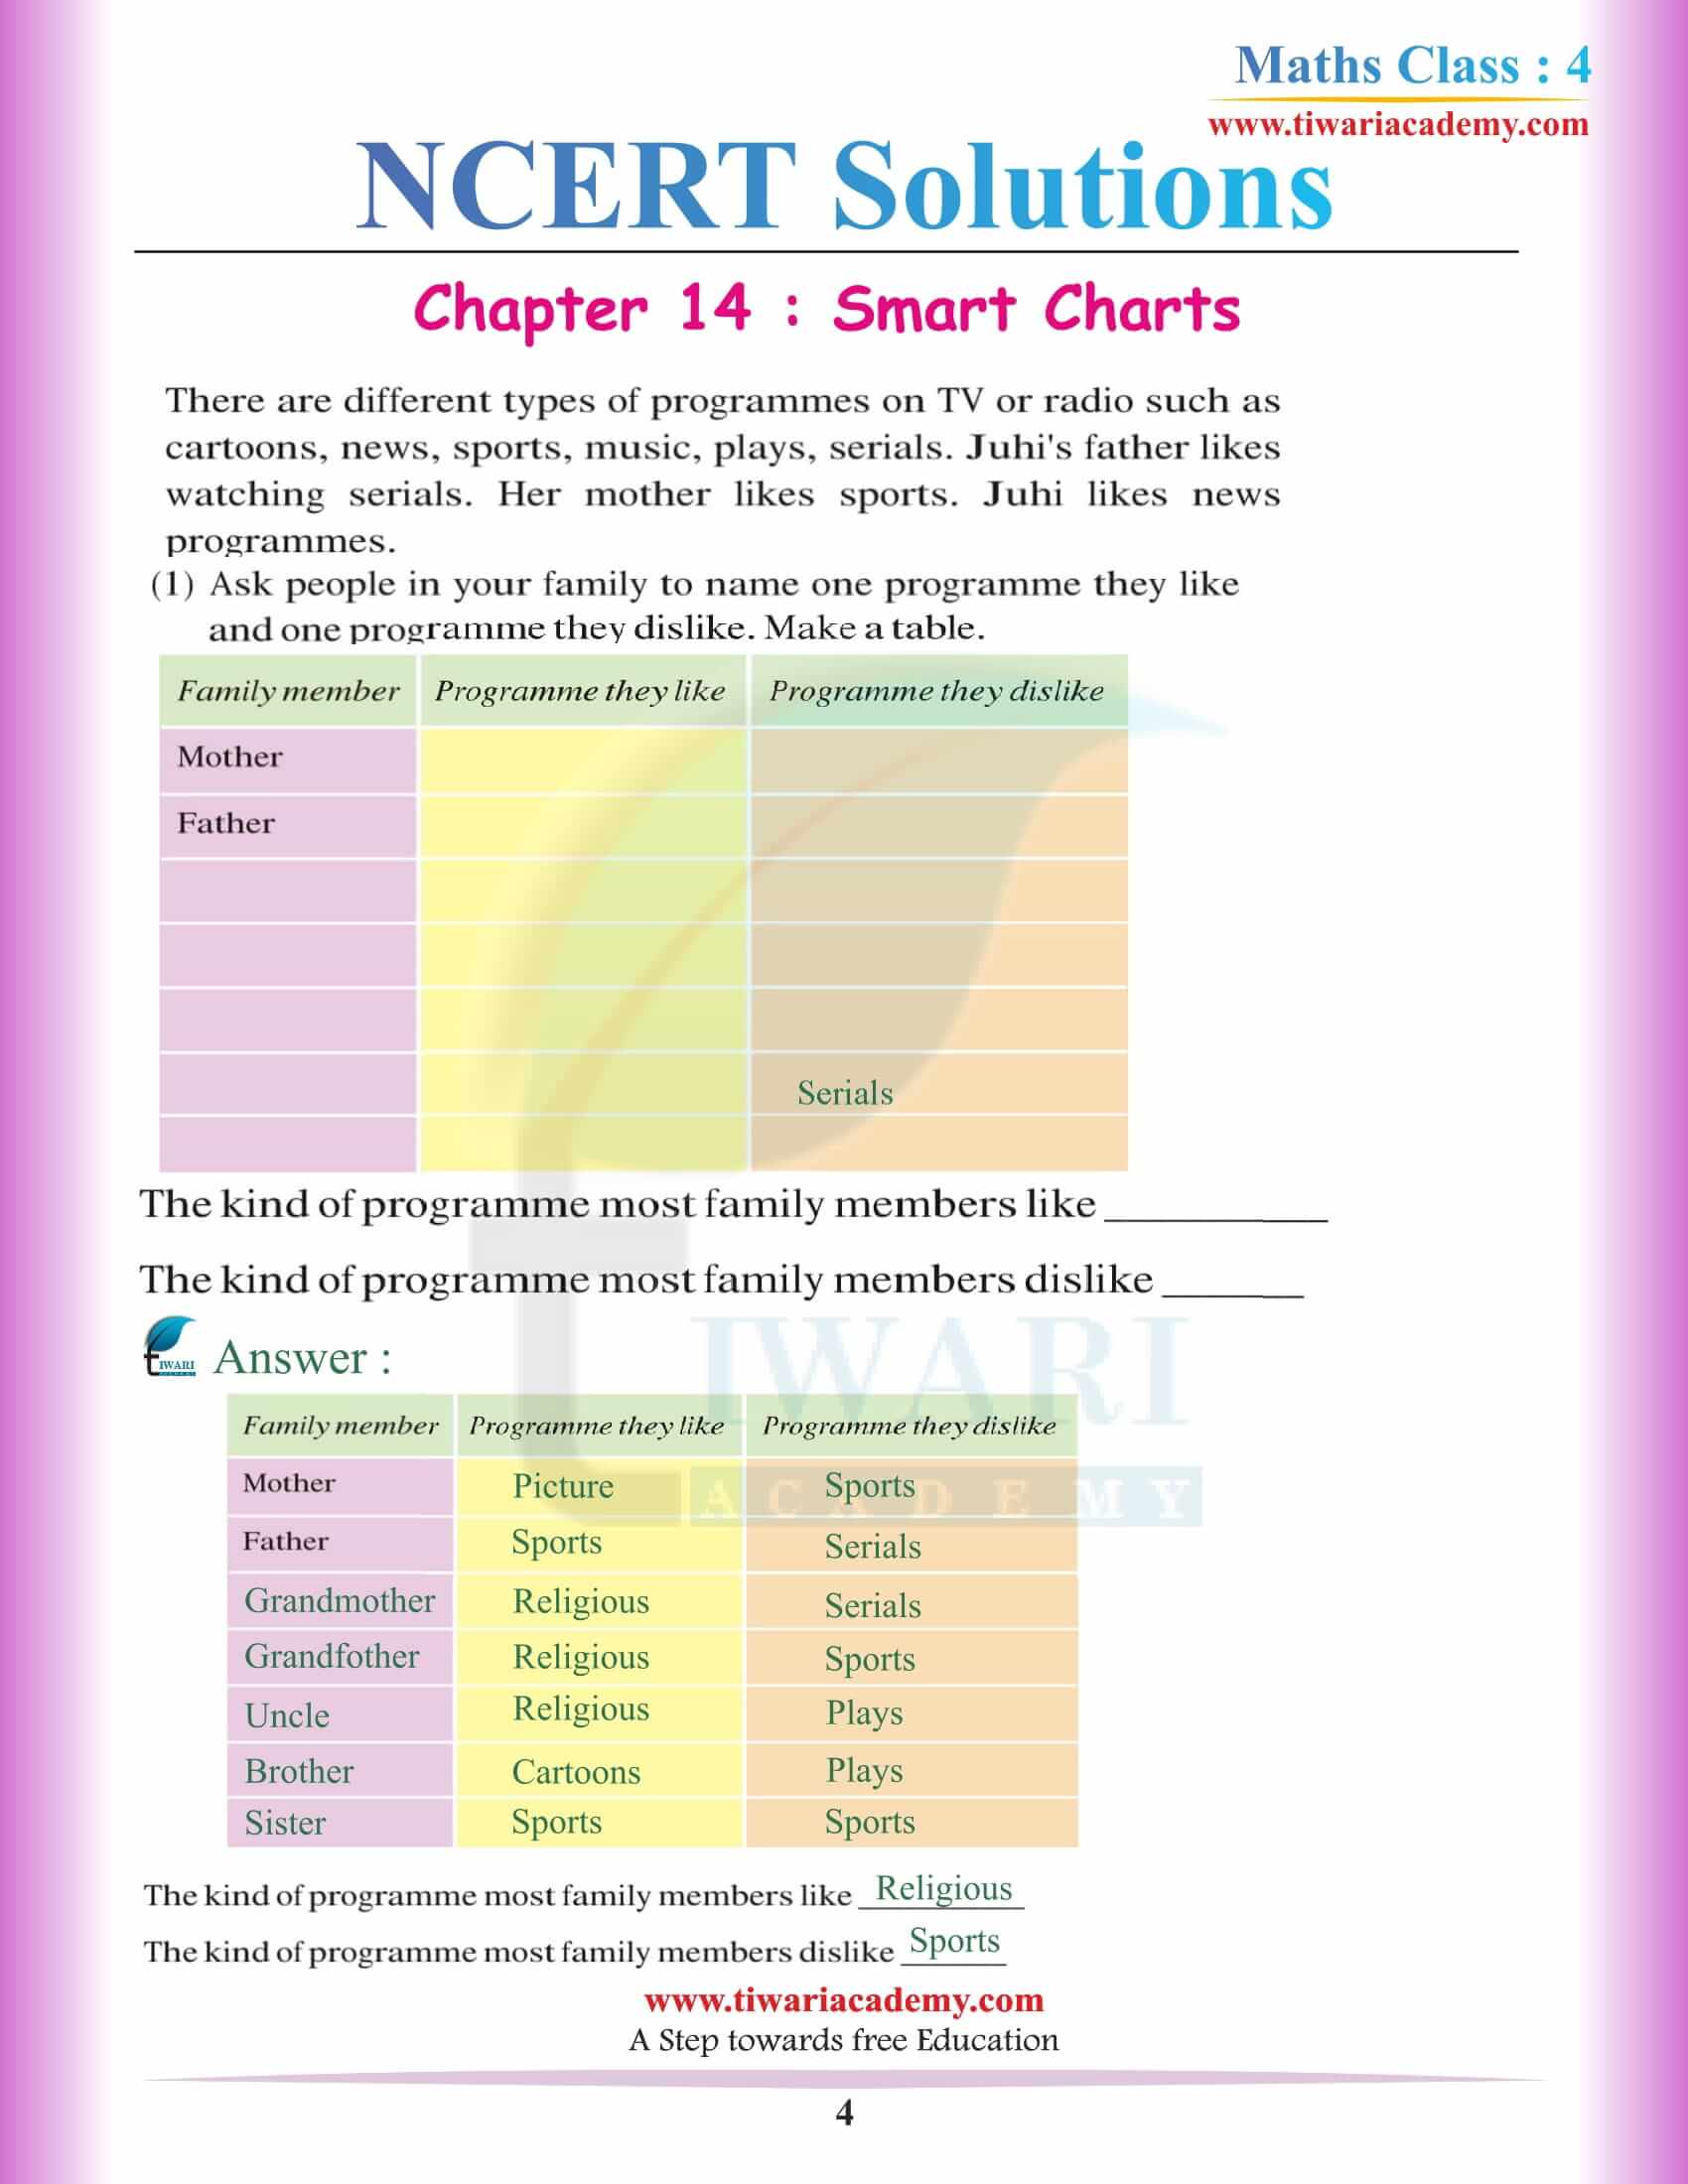
Class 4 NCERT Maths Chapter 14 Utilization of Time
Cover everyone likes to watch T.V. and now and then have you ever considered that you can do a lot of many things while you are watching the T.V. and wasting the time. This chapter will show you how you can be more productive and use your time in better way.
You have already learned how to make the data and utilize it to get the knowledge. So this chapter will make you do some interesting data which will give you some of the most interesting facts that you can change your perceptions of how you do the things in your whole day. Try to improve this time by creating the data in some other way so that you can showcase the skill that you gather by practicing.
CBSE Class 4 NCERT Maths Chapter 14 Activity
This chapter already gave you some of the topics you can make the data but try to make the data with some different designs, not just simple tables. However, it is not bad idea that your table making is wrong but try to take help from your elder sibling or maybe from your parents. As long as the results are good and accurate you are good with the study.
4th Mathematics Chapter 14 Collecting Data
Check during the watching T.V. how much time you have actually wasted and what if you had utilized that time looking into the encyclopedia in your bookshelf may be drawing some important shapes an or maybe study about the sum the interesting facts about the animal and environment around you.
The last option is to practice chapters that you have already studied because you might be able to play again. Once you are completing your chapters then no one will ask you not to play because you had already practiced the math.
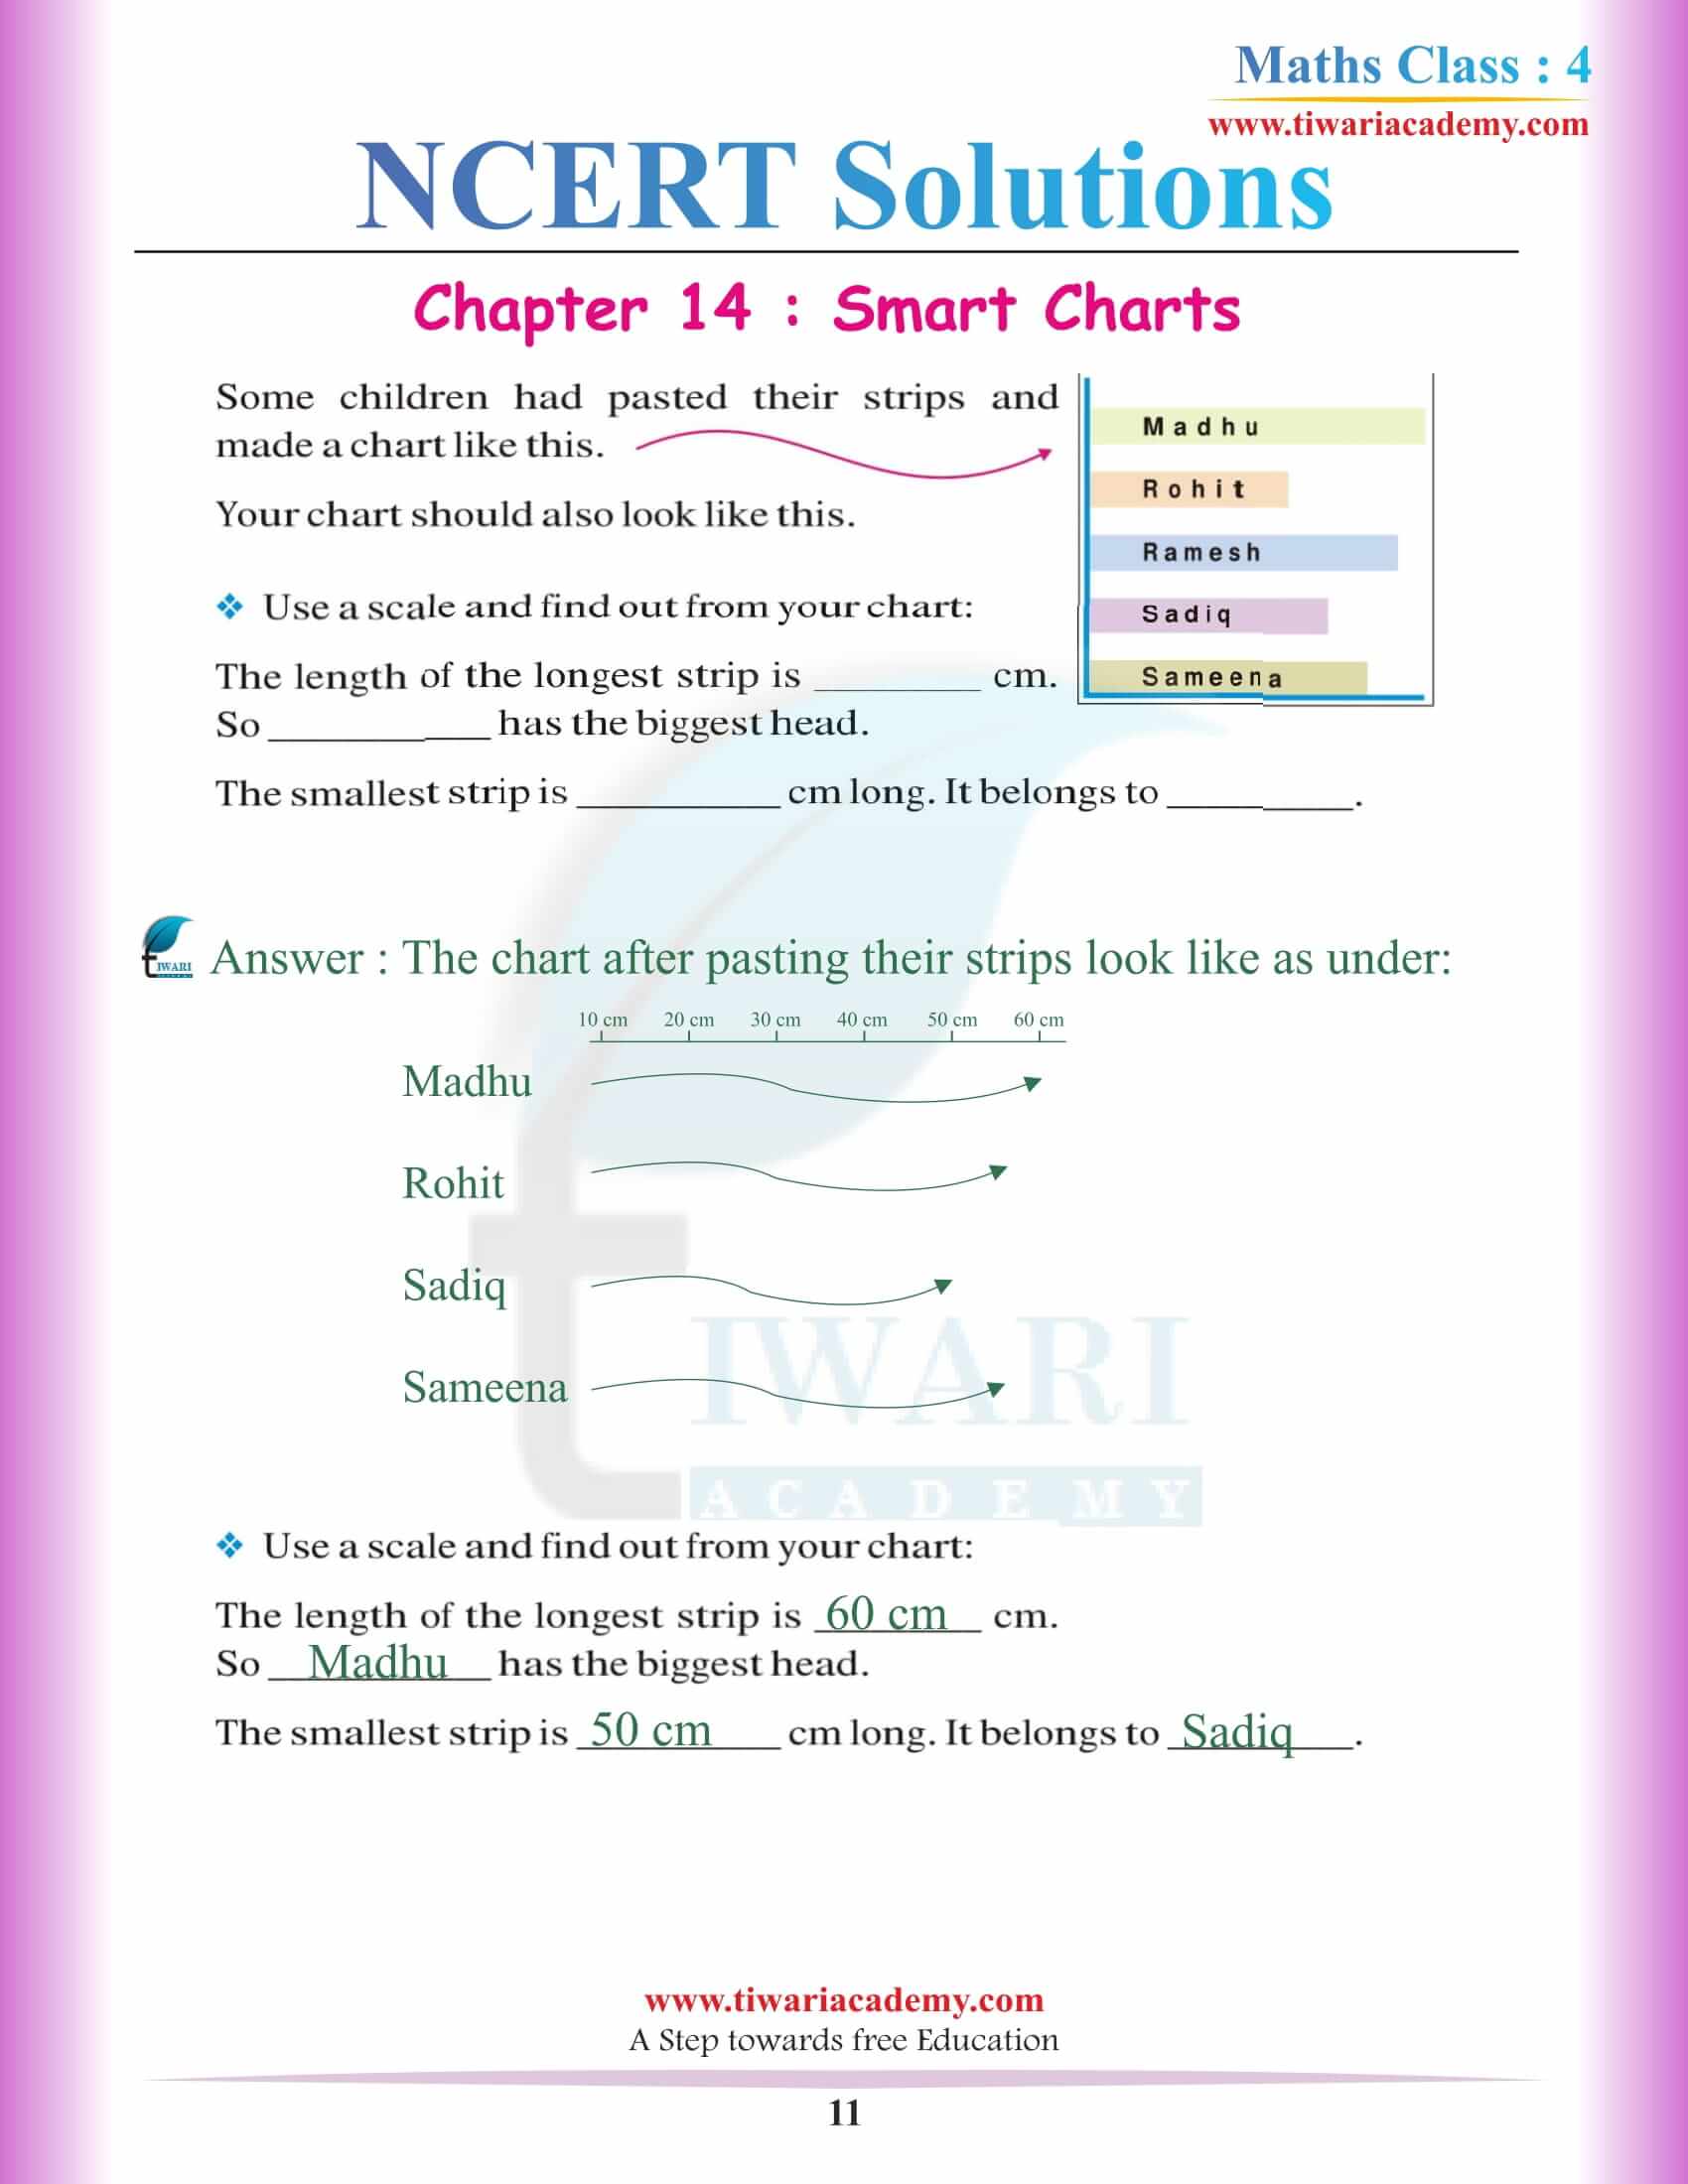
Class 4 NCERT Maths Textbook Chapter 14 Whose Head is Bigger
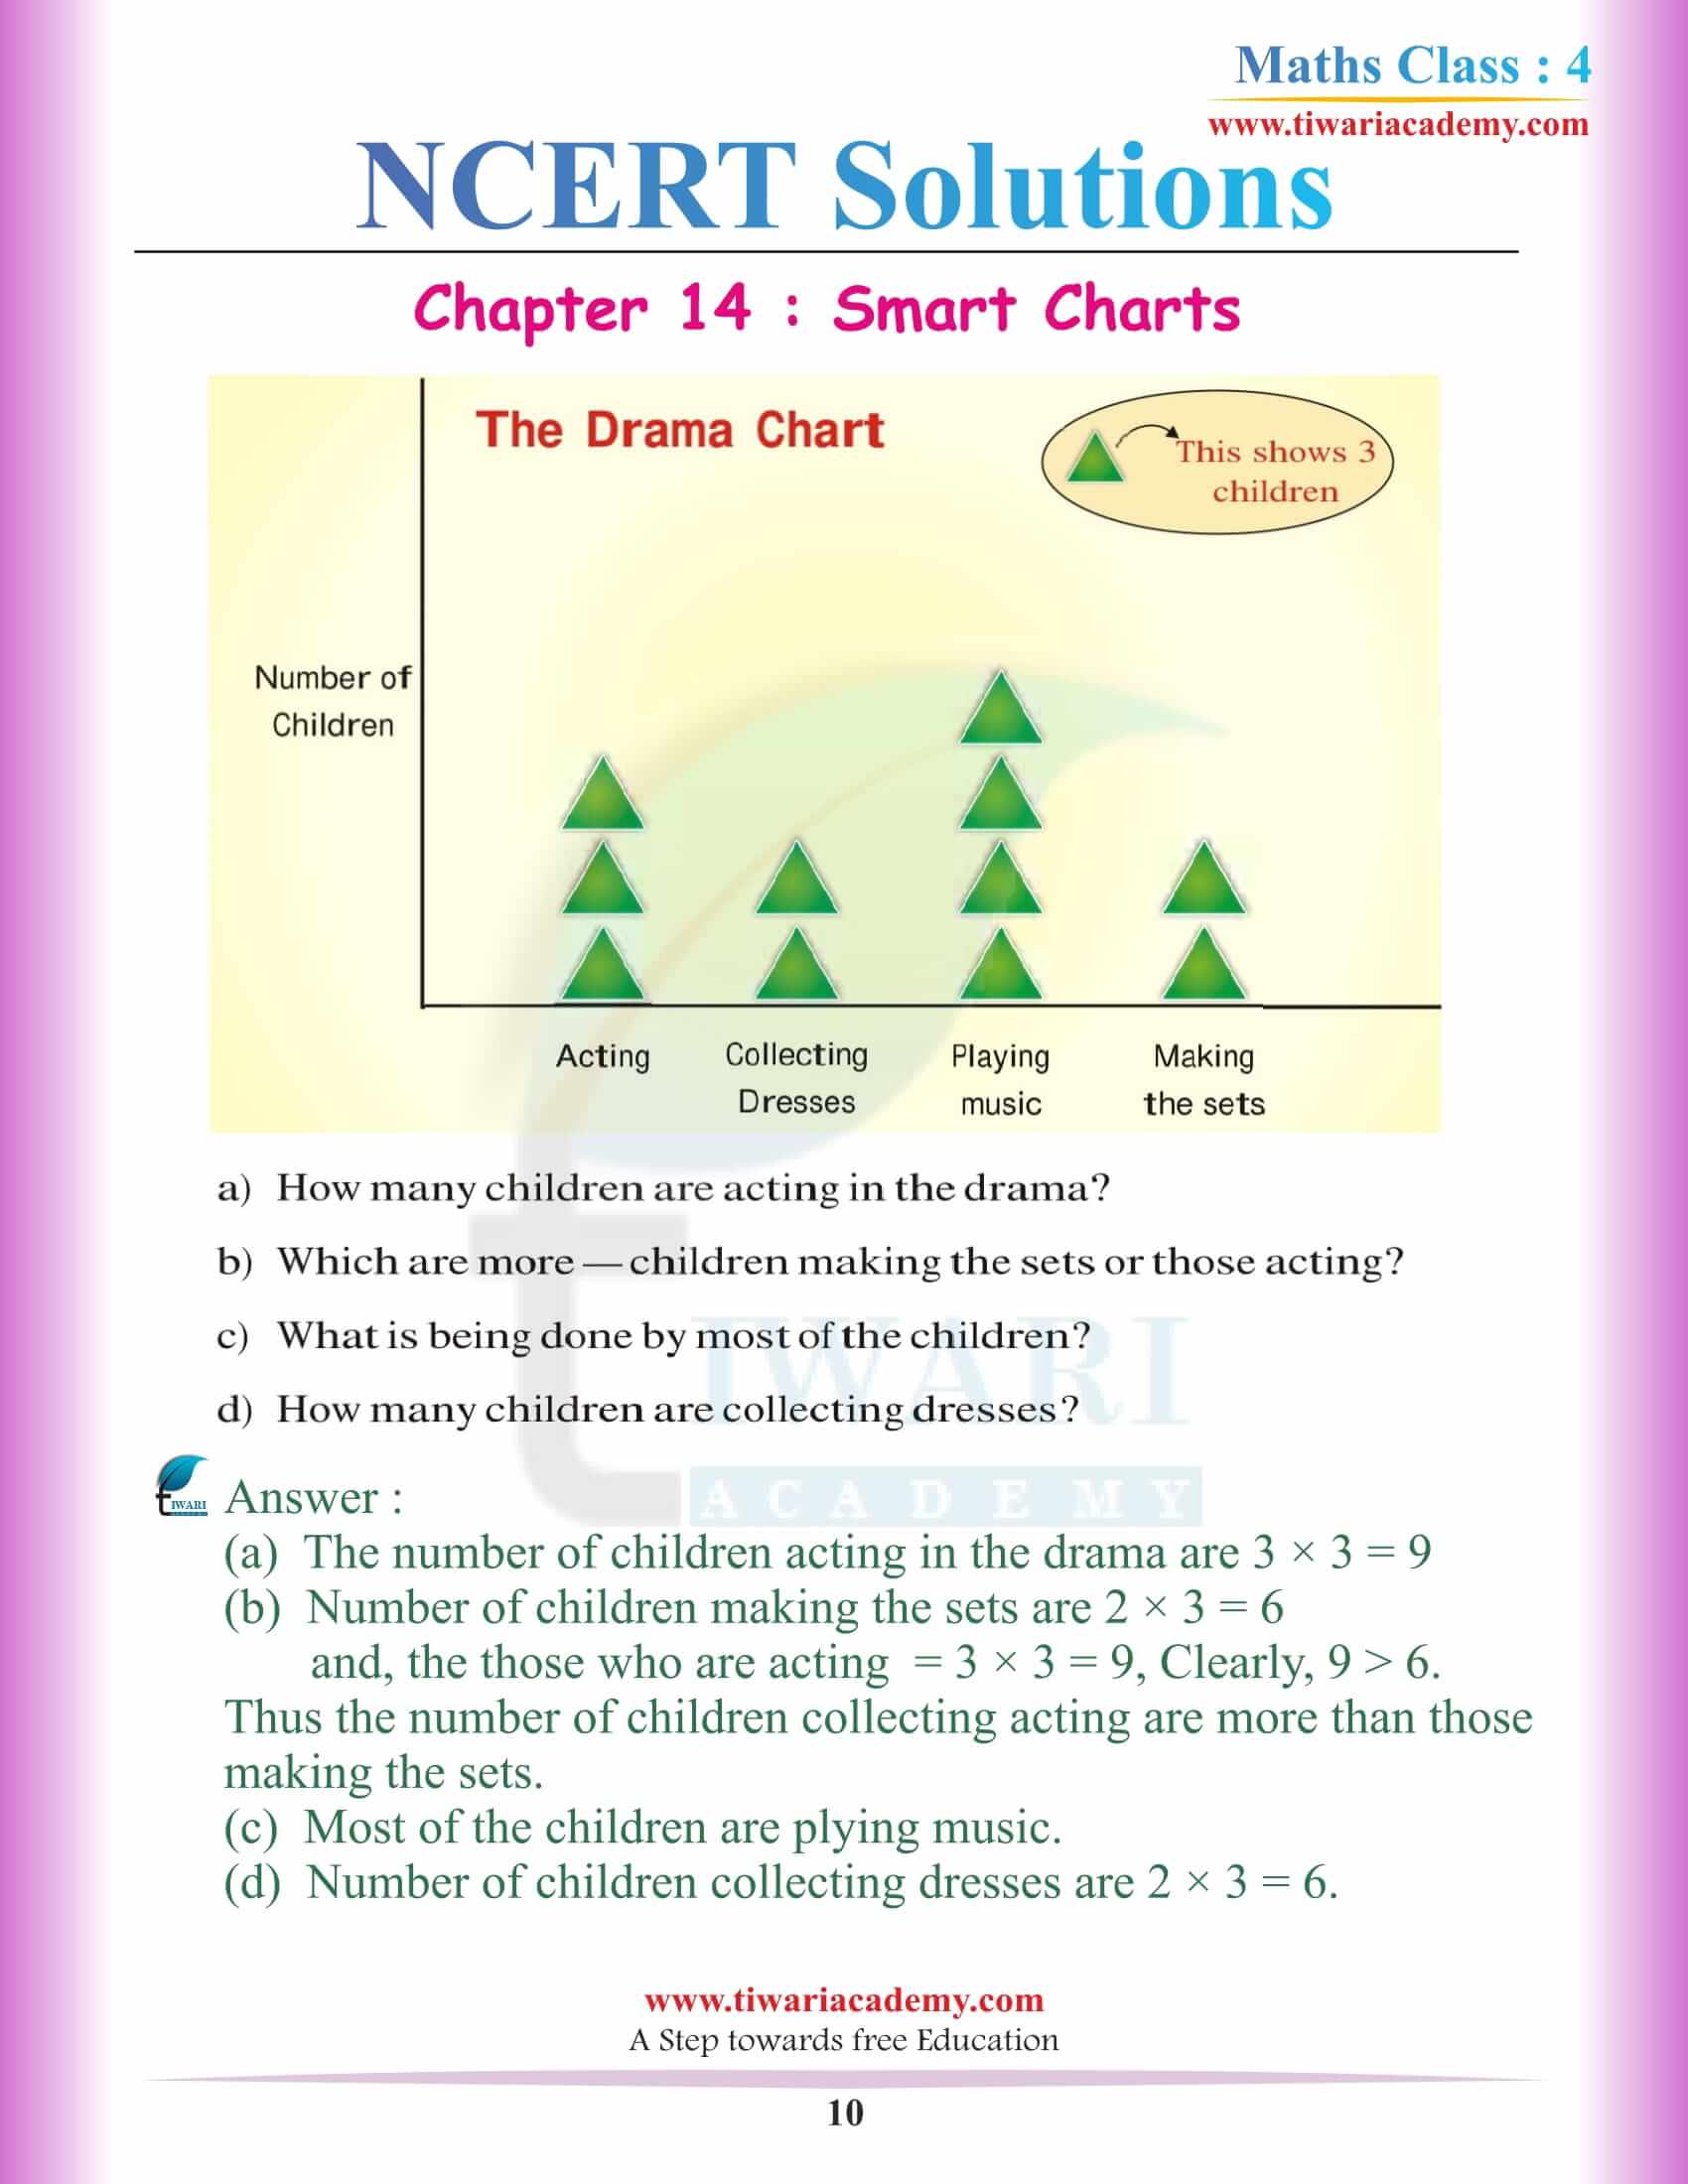
These all things are already given in the chapter if you read and make the data. You will find-out it yourself. Not only that data, things are only interesting topic in the chapter found it. you can actually measure the head of your friend’s. How to prepare the drama for your class and school is also a challenge and I suggest that you complete the work and check these topics and study well and try to implement the idea to make drama for your class.
This is the best thing as you don’t have to compete for anyone and also who doesn’t want to act as the princess or maybe king in shiny armor. This all is given in the chapter if you read the chapter instead of wasting time on T.V.
Class 4 Maths Mela Chapter 14 Data Handling – FAQs
What is taught in Class 4 Maths Mela Chapter 14 Data Handling?
Class 4 Maths Mela Chapter 14 Data Handling introduces students to the basic idea of collecting, organising, and understanding data. Through simple and relatable examples like favourite subjects, colourful golas, games and Bal Mela sales, students learn how information can be gathered and represented. The chapter focuses on using lists, tables and pictographs to compare data and find the most or least common items, making mathematical thinking practical and enjoyable.
Why is asking the correct question important in Class 4 Maths Mela Chapter 14?
In Class 4 Maths Mela Chapter 14, students learn that the quality of data depends on how the question is framed. A clear question like “Which subject do you like the most?” helps collect one definite answer from each student. This avoids confusion and makes counting easier. Asking the right question ensures accurate comparison and helps in correctly identifying the most liked or least liked option, which is a key concept of data handling.
How do tables help students in Class 4 Maths Mela Chapter 14 Data Handling?
Tables play an important role in Class 4 Maths Mela Chapter 14 because they organise data neatly into rows and columns. When information is shown in a table, students can easily compare numbers and understand results faster than reading a long list. Tables help children identify patterns, find totals and decide which item appears most or least, making data interpretation simple and clear.
What is a pictograph and how is it used in Class 4 Maths Mela Chapter 14?
A pictograph is a method of representing data using pictures or symbols. In Class 4 Maths Mela Chapter 14, pictographs are used in activities like colourful golas and Bal Mela food sales. Pictures make data visually attractive and easy to understand. Students can count symbols to compare quantities, helping them answer questions accurately while making learning more engaging and enjoyable.
How do students differentiate boys’ and girls’ data in Class 4 Maths Mela Chapter 14?
In Class 4 Maths Mela Chapter 14, boys’ and girls’ data is shown separately through different records maintained by Rohan and Anjali. Each section is clearly labelled, allowing students to count and compare data without guessing. This teaches children how data can be grouped meaningfully and compared properly, helping them understand differences between categories in a clear and organised way.
How do NCERT Solutions help in understanding Class 4 Maths Mela Chapter 14 Data Handling?
NCERT Solutions for Class 4 Maths Mela Chapter 14 provide step-by-step explanations in simple language. They help students understand how to read tables, count pictographs, compare data and answer reasoning-based questions. These solutions are useful for homework, revision and exam preparation. By following NCERT Solutions, students gain confidence in data handling and improve their analytical and problem-solving skills.