by Tiwari Academy
NCERT Textbook Solutions for Class 10 Maths Chapter 14 Probability in English and Hindi Medium for CBSE Session 2025-26. As per the revised NCERT Math textbooks published for CBSE 2025-26 Exams, there are only one exercise in Class 10 Mathematics book Chapter 14. NCERT Updated Solutions for Class 10 Maths Chapter 14 Probability, provide a comprehensive understanding of the topic through detailed explanations and step-by-step solutions. Probability, a fundamental concept in mathematics, is extensively covered in the Class 10 Maths Probability Chapter Solutions. The chapter focuses on real-life applications, making it easier for students to grasp the subject.
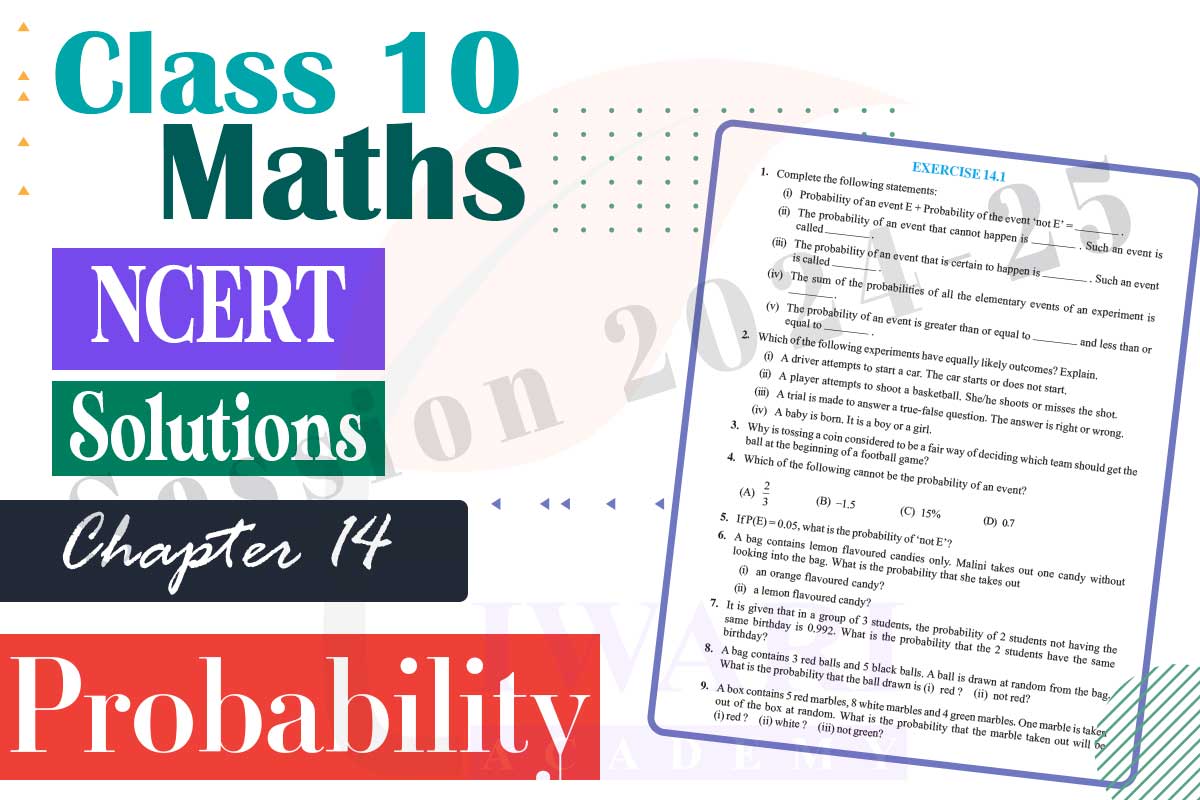
NCERT Exercise Solutions for Class 10 Maths Chapter 14
With NCERT Class 10 Math Book Chapter 14 Solutions PDF, students can practice questions anywhere, ensuring effective preparation. These solutions simplify topics such as random experiments, outcomes, and events, helping students excel in exams. NCERT Book Class 10th Probability Chapter includes varied exercises designed to challenge and improve problem-solving skills. By using the Class 10 Mathematics Probability NCERT Solutions, students can clarify doubts and build confidence in tackling probability-based questions effectively.
10th Maths Chapter 14 Solutions for CBSE Board
NCERT Class 10 Maths Chapter 14 Exercise Solutions are an essential resource for mastering Probability. This chapter introduces students to crucial topics like theoretical probability and its practical applications. With the Class 10th NCERT Mathematics Chapter 14 Solutions PDF, students can easily access answers to complex problems, ensuring a thorough revision. The NCERT Book Class 10 Math Probability Chapter equips learners with the tools needed to understand random events and predict outcomes.
These NCERT Revised Solutions for Class 10 Mathematics Probability are highly reliable, as they align with the latest CBSE curriculum. Practice exercises in the NCERT Grade 10th Math Probability Chapter Solutions focus on real-world scenarios, making the subject interesting and relatable. With Class 10 Maths Chapter 14 Solutions, students can systematically cover all topics, enhancing their ability to solve exam-level questions confidently.
10th Maths Chapter 14 Solutions for State Boards
The NCERT Class 10 Maths Book Chapter 14 PDF Solutions serve as a valuable guide for students preparing for board exams. The Probability chapter not only strengthens mathematical concepts but also develops analytical skills. NCERT Textbook Solutions for Class 10 Mathematics Chapter 14 simplify challenging problems, allowing students to understand the logic behind probability calculations. With Class 10 Math Probability NCERT Solutions, learners can build a solid foundation by practicing various question types.
The NCERT Book Class 10 Probability Chapter emphasizes clear explanations, helping students grasp key concepts with ease. Topics such as the probability of complementary events and compound events are thoroughly explained in the Class 10 Maths Chapter 14 Exercise Solutions. By studying the Probability Chapter Class 10 NCERT Solutions PDF, students can effectively bridge gaps in understanding and perform better in their exams.
| Class: 10 | Mathematics |
| Chapter 14: | Probability |
| Content: | NCERT Exercise Solutions |
| Content Mode: | Images, Text and Online Videos |
| Session: | CBSE 2025-26 Board Exams |
| Medium: | English and Hindi Medium |
Important Points in Class 10 Maths Chapter 14 Probability
Theoretical Probability: Formula: P(E) = Total outcomes/Number of favorable outcomes.
Complementary Events: P(E) + P(not E) = 1.
Application-Based Problems: Focus on dice, coins, and cards.
Real-Life Examples: Practical scenarios like weather prediction.
Board Exam Pattern: Emphasis on accuracy and step-by-step solutions.
| Day | Topics to Cover | Activities | Resources |
|---|---|---|---|
| Day 1 | Introduction to Probability | Read NCERT theory, understand basic terms like outcomes and events | NCERT textbook, online video lectures |
| Day 2 | Theoretical Probability | Practice solving simple probability questions | NCERT Exercise 14.1, solved examples |
| Day 3 | Complementary Events | Solve problems on complementary events and their probabilities | NCERT questions, sample papers |
| Day 4 | Real-Life Applications | Work on problems involving dice, coins, and cards | Practice worksheets, previous year questions |
| Day 5 | Revision | Review mistakes, practice weak areas | Mock tests, board exam sample papers |
NCERT Solutions for Class 10 Maths Chapter 14
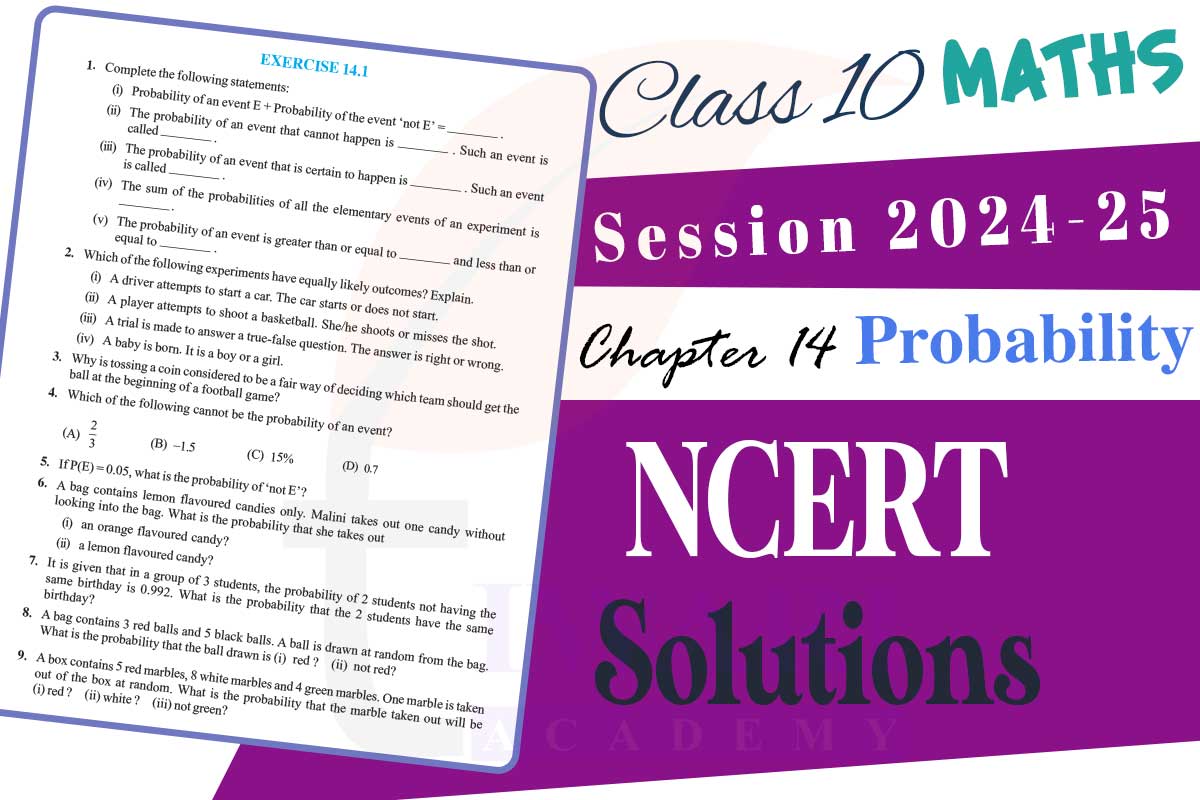
Class 10 Maths Chapter 14 Exercise 14.1 in English and Hindi medium for CBSE, UP Board, MP Board to download updated for new academic session 2025-26. These NCERT Solutions are applicable for UP Board also as UP Board has implemented NCERT Textbooks as UP Board Textbooks for the academic session 2025-26. UP board Students can download UP Board solutions for Class 10 Maths Chapter 14 all exercises. These solutions are applicable for all the students who are following CBSE Board for academic session 2025-26. Not only NCERT Solutions but the NCERT Books also for all subjects along with Offline Apps of NCERT Textbook’s Solutions for class 10 all subjects. Videos related to Ex 14.1 of class 10 Maths are given below explaining each and every questions. Explanation is in simple language, so that students can understand easily.
Class 10 Maths Exercise 14.1 Solution in Videos
What do you understand by Random Experiment?
Random Experiment: A random experiment is one in which the exact outcome cannot be predicted.
What is meant by Trial in Probability?
Trial: Performing a random experiment is called a trial.
What is meant by Outcomes?
Outcomes: The result of a random experiment is called an outcome.
What is Sample space in terms of Probability?
Sample space: The collection of all possible outcomes of a random experiment is called a sample space.
What are Events in Probability?
Event: Any possible outcome or combination of outcomes of a random experiment is called an event.
Which events are called Equally likely events?
Equally likely events: Two or more events of a random experiment are said to be equally likely events if each one of them have an equal chance of occurrence.
What is meant by Probability of an event?
Probability of an event: The chance of occurrence of the event expressed quantitatively is known as the probability of an event and denoted by P(E).
10th Maths Chapter 14 Solutions
NCERT Solutions for Class 10 Maths Chapter 14 Exercise 14.1 of Probability is given below for academic session 2025-26. NCERT Solutions for class 10 is updated according to CBSE Curriculum 2025-26. Join the discussion forum to ask your questions and answer the questions already asked by other users.
Important Questions on Class 10 Maths Chapter 14
Why is tossing a coin considered to be a fair way of deciding which team should get the ball at the beginning of a football game?
When we toss a coin, the possible outcomes are only two, head or tail, which are equally likely outcomes. Therefore, the result of an individual toss is completely unpredictable.
It is given that in a group of 3 students, the probability of 2 students not having the same birthday is 0.992. What is the probability that the 2 students have the same birthday?
Probability that two students are not having same birthday P (not E) = 0.992 Probability that two students are having same birthday P (E) = 1 − P (not E) = 1 − 0.992 = 0.008
A die is thrown once. Find the probability of getting a prime number.
The possible outcomes when a dice is thrown = {1, 2, 3, 4, 5, 6} Number of possible outcomes of a dice = 6 Prime numbers on a dice are 2, 3, and 5. Total prime numbers on a dice = 3 Probability of getting a prime number = 3/6 =1/2
Five cards−−the ten, jack, queen, king and ace of diamonds, are well-shuffled with their face downwards. One card is then picked up at random. What is the probability that the card is the queen?
Total number of cards = 5 Total number of queens = 1 P(getting a queen) = (Number of favourable outcomes)/(Number of total possible outcomes) =1/5
A lot of 20 bulbs contain 4 defective ones. One bulb is drawn at random from the lot. What is the probability that this bulb is defective?
Total number of bulbs = 20 Total number of defective bulbs = 4 P(getting a defective bulb) = (Number of favourable outcomes)/(Number of total possible outcomes) = 4/20 = 1/5
A box contains 90 discs which are numbered from 1 to 90. If one disc is drawn at random from the box, find the probability that it bears a two-digit number.
Total number of discs = 90 Total number of two-digit numbers between 1 and 90 = 81 P (getting a two-digit number) = 91/90 = 9/10
Previous Years Questions
ONE MARK QUESTIONS
A number is chosen at random from the numbers -3, -2,-1, 0, 1, 2, 3. What will be the probability that square of this number is less than or equal to 1? [CBSE 2017]
THREE MARKS QUESTIONS
Two different dice are thrown together. Find the probability that the numbers obtained
(i) have a sum less than7
(ii) have a product less than 16
(iii) is a doublet of odd numbers. [CBSE 2017]
FOUR MARKS QUESTIONS
Peter throws two different dice together and finds the product of the two numbers obtained. Rina throws a die and squares the number obtained. Who has the better chance to get the number 25? [CBSE 2017]
About Probability
The measure of certainty of events in numerical values, under certain conditions, is provided by the branch of mathematics called Theory of Probability. This theory has extensive use as one of the basic tools in statistics and wide range of applications in Science, engineering, biological science, medical, commerce, weather forecasting etc.
Historical facts!
1. The concept of probability was developed in a very strange manner. In 1654, a gambler by name Chevalier de Mere approached the well-known 17th century French philosopher and mathematician Blaise Pascal regarding certain dice problems. Pascal discussed them with another French mathematician Pierre de Fermat and they found solution to dice problems. This work was the beginning of probability theory.
2. Probability theory has its actual origin in the 16th century when an Italian physician and mathematician J. Cardan wrote the first book on the subject ‘The book on Games of Chance’. Since its inception, the study of Statistics and probability has attracted the attention of great mathematicians (James Bernoulli (1654 – 1705), A. de Moivre (1667 – 1754) and Pierre Simon Laplace (1749 – 1827)).
3. In 1812, Pierre Simon Laplace or Pierre de Laplace (1749 – 1827, France) proposed a mathematical system of inductive reasoning based on probability. He introduced many principles of probability, one among them is, “Probability is the ratio of the favoured events to the total possible events”.
4. Statistician Karl Pearson (1857 – 1936) had tossed the coin 24000 times and he got 12012 heads. Then calculated experimental probability 12012/2400 = 0.5005.
5. In the eighteenth century French De Buffon tossed a coin 4040 times and got 2048 heads. Then he calculated experimental probability 2048/4040 = 0.507.
What are NCERT Solutions for Class 10 Maths Chapter 14 Probability?
NCERT Updated Solutions for Class 10 Mathematics Chapter 14, Probability, are a set of expertly crafted answers to all the exercise questions in the chapter. These solutions help students understand concepts like random experiments, outcomes, events and theoretical probability. Designed as per the CBSE syllabus, the solutions provide step-by-step explanations to make complex problems simpler. They also include examples that link probability to real-world situations, making the subject more relatable and engaging. With the help of these solutions, students can practice effectively, clarify doubts and prepare confidently for their board exams.
How many examples are there in chapter 14 Probability of class 10 Maths?
There are two exercises in chapter 14, Probability (class 10 Maths). In the exercise 14.1, there are 25 questions. There are 13 examples in chapter 14 of class 10 math. All the examples and questions of this chapter are good.
How do NCERT Class 10 Maths Probability Chapter Solutions help in exam preparation?
NCERT Book Class 10 Mathematics Probability Chapter Solutions are tailored to align with the CBSE board exam pattern, ensuring students focus on important topics. These solutions provide step-by-step guidance for solving problems, enabling a deep understanding of key concepts like complementary events and theoretical probability. By practicing the questions included in these solutions, students can identify common mistakes and improve their accuracy. The NCERT Class 10 Maths Chapter 14 Solutions PDF format allows easy access for revision anytime, helping students strengthen their problem-solving skills and build confidence before exams.
What are real-life applications of Probability in Class 10 Maths Chapter 14?
Probability has something to do with a chance. It is the study of things that might happen or might not. We use it most of the time, usually without thinking of it.
Some real-life applications of Probability:
- Weather Forecasting: Before planning for an outing or a picnic, we always check the weather forecast.
- Flipping a coin or Dice.
- Lottery Tickets: Winning or losing a lottery is one of the most interesting examples of Probability.
- Playing Cards: There is a probability of getting a desired card when we randomly pick one out of 52.
Where can I find Class 10 Maths Chapter 14 NCERT Solutions in PDF format?
Class 10 Mathematics Chapter 14 NCERT Revised Solutions in PDF format are widely available online for free. These PDFs can be downloaded from official educational websites, NCERT’s official website or trusted platforms like Tiwari Academy. The PDF includes detailed solutions to all exercises in the Probability chapter, ensuring students have access to comprehensive study material. These files are portable and easy to use on various devices, making them a convenient option for last-minute revisions or regular practice sessions. Students can download these resources to enhance their learning experience and excel in the topic.
Is there any optional exercise in chapter 14 of class 10th Maths?
No, there is not any optional exercise in chapter 14 of class 10th Maths. The second exercise was earlier the optional exercise but now it is deleted from syllabus.
Why is Probability important in Class 10 Maths?
Probability is an essential topic in Class 10 Maths because it lays the foundation for advanced mathematical and statistical concepts. This chapter helps students understand how to predict the likelihood of various events, a skill applicable in real-world scenarios like decision-making, risk analysis and scientific research. By learning probability through NCERT Class 10 Math Chapter 14 Solutions, students develop analytical thinking and problem-solving abilities. These concepts are not only relevant for academic purposes but also find applications in competitive exams and everyday life, making Probability a critical part of the Class 10 Maths syllabus.
Is chapter 14 of class 10th math easy to understand?
Chapter 14 of class 10th Maths is not easy and not difficult. It lies in the middle of easy and difficult because some examples and questions of this chapter are easy, and some are difficult. However, the difficulty level of anything varies from student to student. So, Chapter 14 of class 10th Maths is easy or not depends on students also. Some students find it difficult, some find it easy, and some find it in the middle of easy and difficult.


