by Tiwari Academy Team
NCERT Exercise Solutions for Class 7 Mathematics Chapter 3 Data Handling and Class 7 Maths Ganita Prakash Chapter 3 A Peek Beyond the Point for Session 2026-27. Get here 7th Maths Chapter 3 Try These Solutions in Hindi and English medium. In Chapter 3 of the Class 7, Mathematics NCERT textbook, Data Handling, students delve into the foundational aspects of data collection and organization. NCERT Class 7th Math chapter 3 emphasizes the mathematical importance of systematically gathering data and representing it in tabular formats, such as frequency distribution tables. By mastering these techniques, students learn to identify patterns and trends within datasets, which is important for effective data analysis.
Class 7 Maths Chapter 3 Solutions in English Medium
NCERT Class 7 Maths Ganita Prakash Chapter 3 A Peek Beyond the Point introduces the concept of the arithmetic mean, teaching students how to calculate the average of a set of numbers. This fundamental statistical measure aids in summarizing data sets and provides a basis for comparison. Understanding these concepts equips students with the skills necessary to interpret and analyze data in various real-life situations. Class 7 Maths Chapter 3, which is about data handling, can vary in difficulty depending on your individual aptitude for the topic and your prior exposure to similar concepts.
Building upon the basics, the NCERT mathematics Class 7 Maths Ganita Prakash Chapter 3 A Peek Beyond the Point further explores measures of central tendency, specifically the median and mode. The median represents the middle value in an ordered data set, offering insights into the data central point. The mode, on the other hand, identifies the most frequently occurring value, highlighting commonalities within the data. Students also learn about the range, which measures the spread between the highest and lowest values, providing an understanding of data variability.
These statistical tools are essential for summarizing and interpreting data effectively. NCERT Maths Textbook chapter 3 of Class 7th introduces bar graphs as a visual method to represent data, enabling students to compare different categories at a glance. Mastering these concepts enhances students’ ability to handle and interpret data proficiently.
Class 7 Maths Chapter 3 Solutions in Hindi Medium
Important Points for Class 7 Mathematics Chapter 3 Data Handling
1. Data Representation: Learn to organize data using frequency tables.
2. Measures of Central Tendency: Understand mean, median and mode.
3. Range: Calculate the difference between maximum and minimum values.
4. Bar Graphs: Master creating and interpreting bar graphs.
5. Probability: Basics of event likelihood.
| Day | Topics to Cover | Study Tips |
|---|---|---|
| Day 1 | Introduction to Data Handling | Read the chapter thoroughly to understand the basic concepts. |
| Day 2 | Organizing Data and Frequency Tables | Practice arranging data in frequency tables with examples. |
| Day 3 | Mean, Median, and Mode | Solve multiple problems to understand how these measures work. |
| Day 4 | Bar Graphs | Draw bar graphs using sample data from the textbook. |
| Day 5 | Probability | Work on examples of simple probability and understand its application. |
| Day 6 | Revision and Practice | Revise the entire chapter and solve previous year questions. |
| Day 7 | Mock Test | Attempt a mock test to evaluate your understanding and time management. |
According to new syllabus and latest NCERT textbooks released for academic year 2026-27, there are only three exercises in chapter 3 data handling of class 7 mathematics. Data handling generally involves collecting, organizing, and interpreting data using different types of graphs and charts.
| Class: 7 | Mathematics |
| Chapter 3: | Data Handling |
| Number of Exercises: | 3 (Three) |
| Content: | Exercises Solutions |
| Mode of Content: | Online Text, Images and Videos |
| Academic Year: | Session 2026-27 |
| Medium: | English and Hindi Medium |
The latter part of 7th NCERT Book Mathematics chapter 3 introduces students to the concept of probability, which quantifies the likelihood of events occurring. Understanding probability is vital, as it forms the basis for predicting outcomes in uncertain situations. NCERT Maths 7th chapter 3 explains how to calculate the probability of simple events, providing a foundation for more complex probabilistic reasoning in higher classes.
By integrating these concepts, the chapter ensures that students develop a comprehensive understanding of data handling, from collection and representation to analysis and interpretation. This holistic approach prepares students to apply statistical and probabilistic methods in real-world contexts, fostering critical thinking and analytical skills essential for academic success and everyday decision-making.
If you’ve already been introduced to basic concepts of data representation and graphs in earlier grades, you might find this chapter easier to grasp. Your level of interest in the topic and your willingness to engage with it can greatly impact how challenging it seems. Finding real-life examples or scenarios that connect with you can make the learning process smoother.
Student’s comfort with mathematical concepts in general can affect their perception of difficulty. If they are comfortable with arithmetic operations and basic algebra, it might help them understand and apply data handling concepts. Data handling often involves interpreting graphs and charts. If they are a visual learner, they might find it easier to understand and analyze graphical representations.
NCERT Solutions for Class 7 Maths Chapter 3
7th Maths solutions of Exercise 3.1, 3.2 and 3.3 in English Medium Video Format. Prashnavali 3.1, 3.2 and 3.3 in Hindi Medium. We have prepared the solutions video in simple way to learn. Tiwari Academy creates the solutions for new CBSE session. Regular practice and a step-by-step approach to understanding the different types of graphs (like bar graphs, pie charts, line graphs, etc.) can make the chapter 3 less challenging. To prepare solutions of class 7 Maths, we use the new NCERT (https://ncert.nic.in/) Textbooks. All the terms are simple in the solutions. PDF and Video solutions are free to use.
NCERT Solutions App for Class 7


An effective teacher and good educational resources can simplify complex topics and make them more accessible. Sometimes, a topic might seem tough initially, but with consistent effort and practice, it becomes more manageable.
Important Questions on Class 7 Maths Chapter 3
The scores in mathematics test (out of 25) of students is as follows: 19, 25, 23, 20, 9, 20, 15, 10, 5, 16, 25, 20, 24, 12, 20. Find the mode and median of this data. Are they same?
Arranging the given data in ascending order:
= 5, 9, 10, 12, 15, 16, 19, 20, 20, 20, 20, 23, 24, 25, 25
Mode is the observation occurred the highest number of times.
Therefore, Mode = 20 Median is the middle observation = 20
Yes, Mode and Median are same of given observation.
Find the mode and median of the data: 13, 16, 12, 14, 19, 12, 14, 13, 14.
Arranging the given data in ascending order, 12, 12, 13, 13, 14, 14, 14, 16, 19
Mode is the observation occurred the highest number of times = 14
Median is the middle observation = 14
Tell whether the statement is true or false: The mode is always one of the numbers in a data.
True.
Read through your textbook to get a clear understanding of the concepts and examples provided. Break down the chapter into smaller sections and focus on one type of graph at a time. Practice drawing graphs and interpreting data sets to reinforce your understanding. If students find certain types of graphs challenging, spend more time on those and seek extra practice resources.
Discuss any doubts with your teacher or classmates to clarify concepts. Look for real-life examples of data representation to make the learning more relatable. Utilize online resources, videos, and interactive tools to enhance your learning experience.
7 Maths Chapter 3 Solutions
7 Maths Chapter 3 Data Handling all exercises solutions with complete explanation are given below. Remember that persistence and a positive attitude are key to mastering any math topic. If you find the chapter tough initially, don’t get discouraged. Keep practicing, seeking help when needed, and you’ll likely find it becoming more manageable over time. No login or password is required to access these solutions for the session 2026-27.
About NCERT Solutions for Class 7 Maths Chapter 3
In 7 Maths Chapter 3 we know about Data Handling. We will study about statistics section of mathematics. It has the collection of data and then their proper likeness to learn. The following are the tools or methods to show:
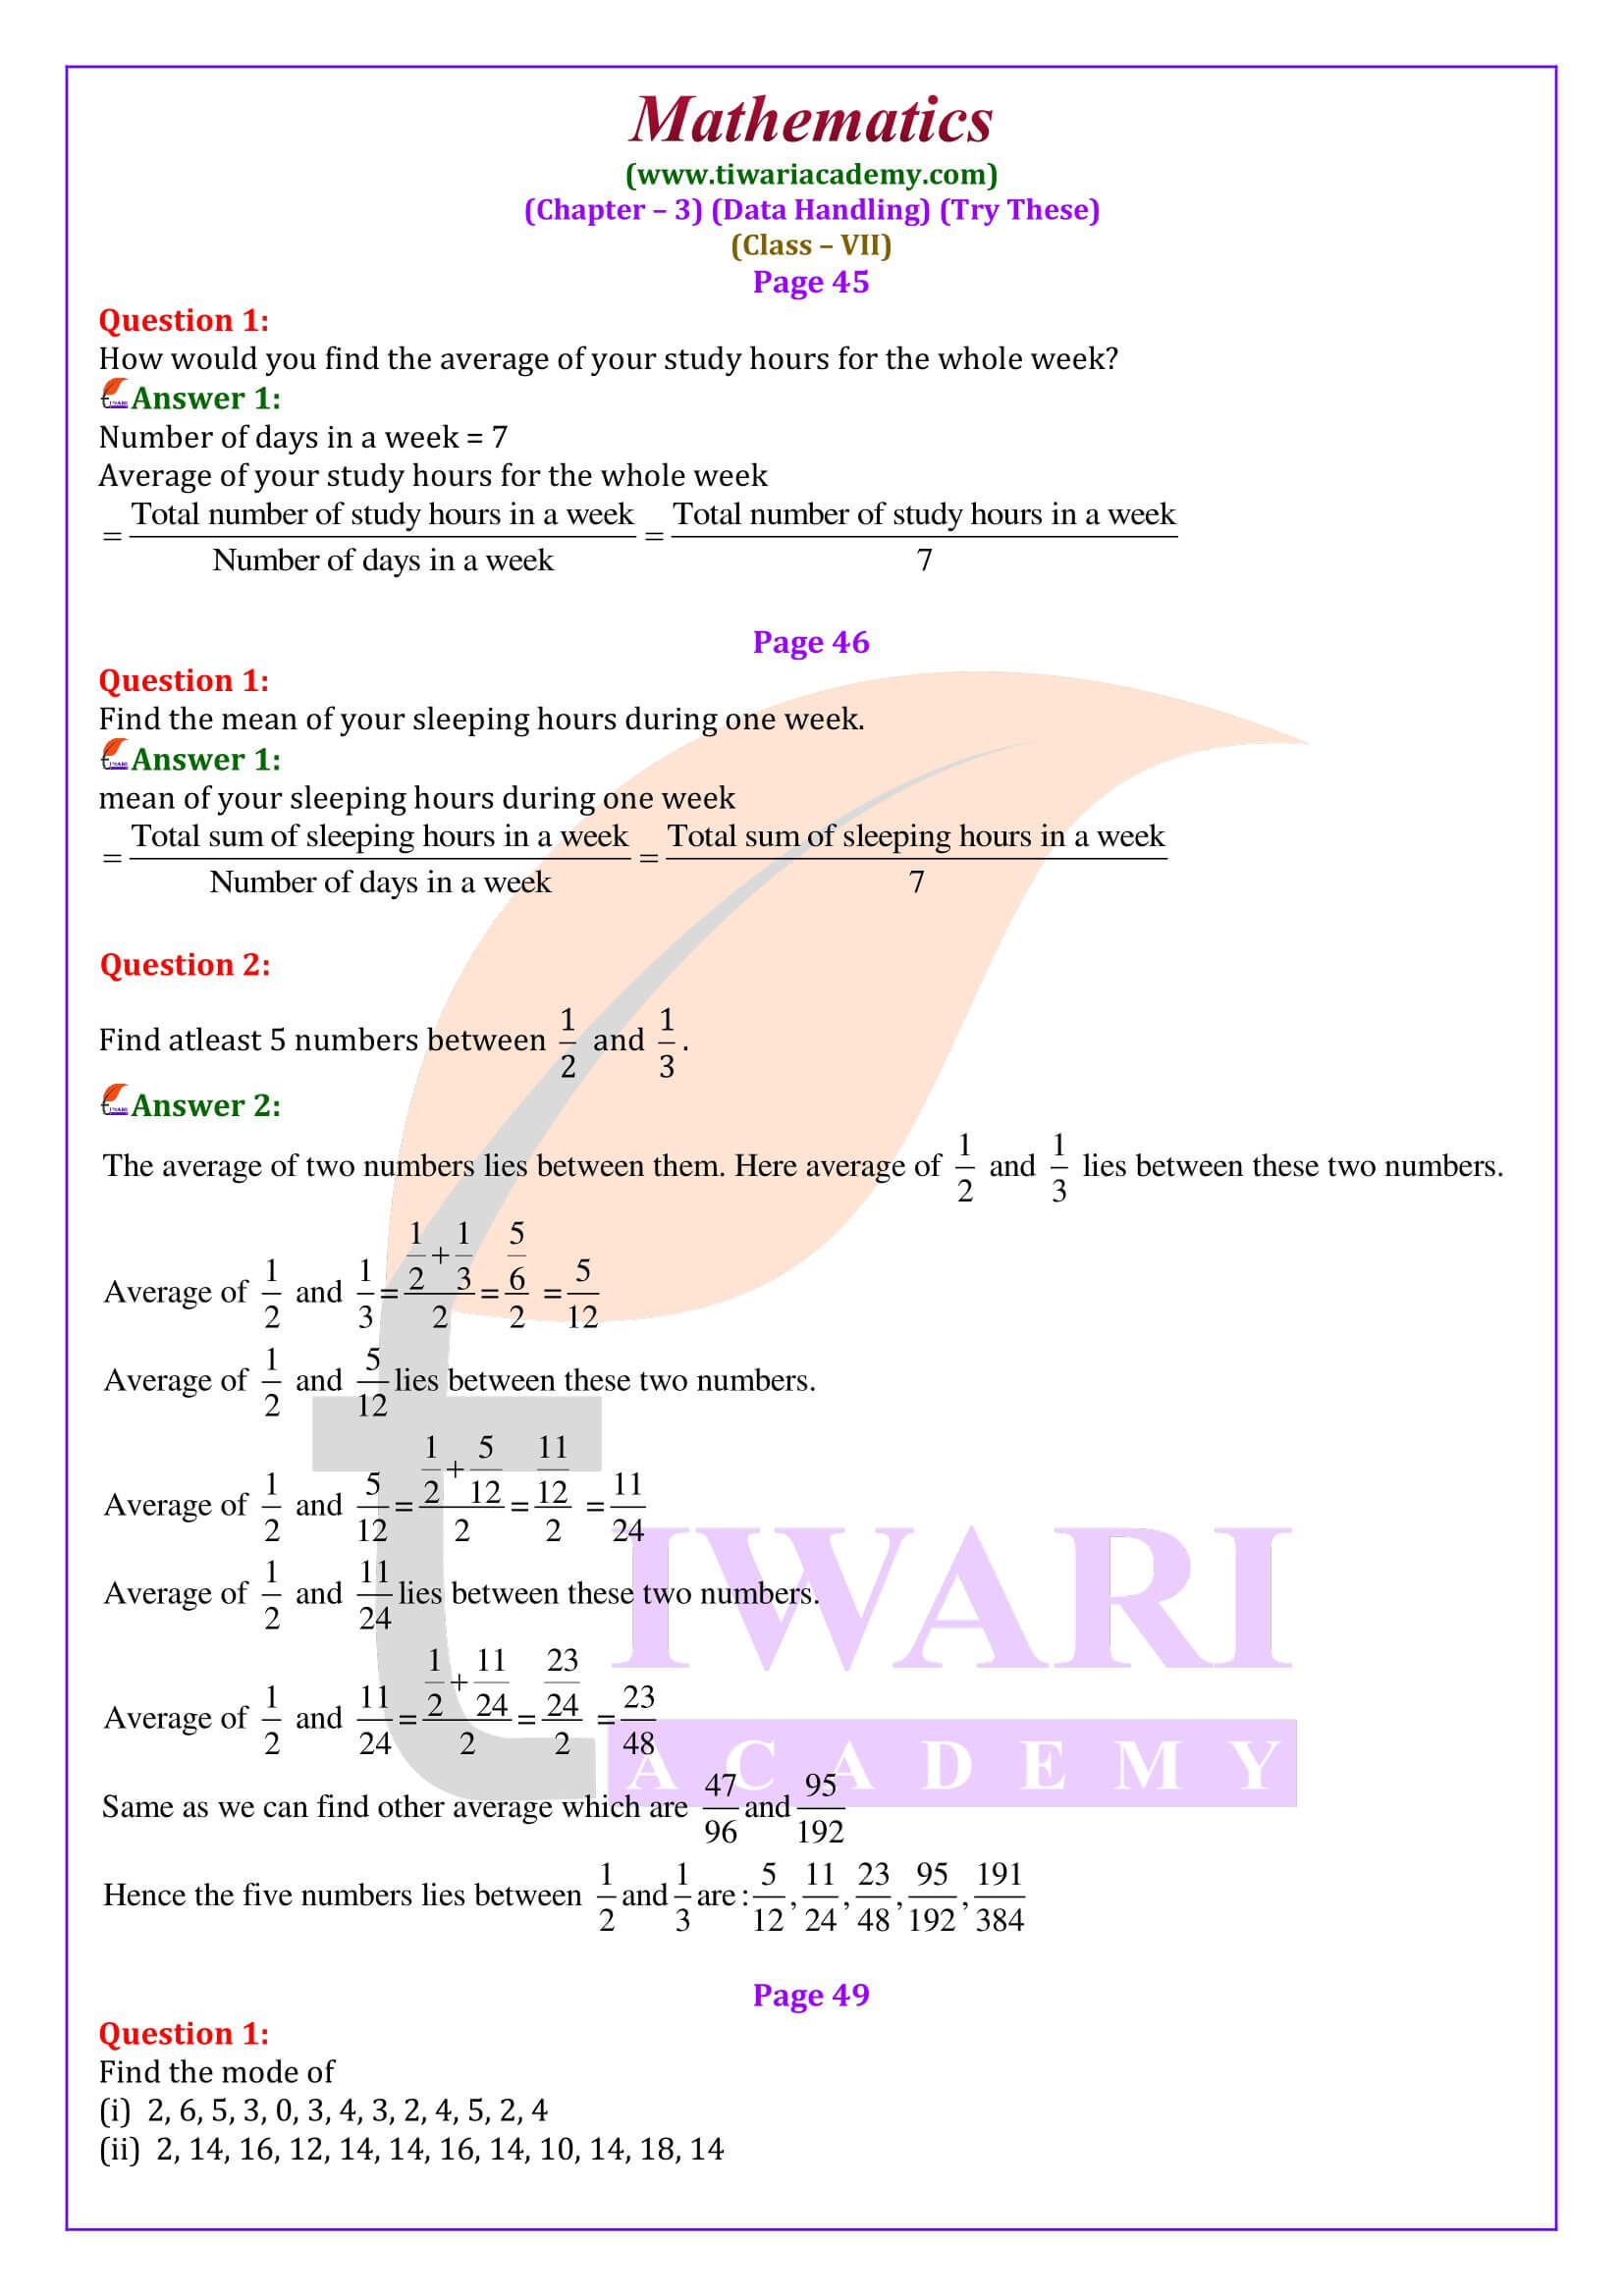
1. Arithmetic Mean: The most common sample value of data is mean. We define it as the sum of values divided by number of terms.
2. Range: The difference between the highest and the lowest term is range.
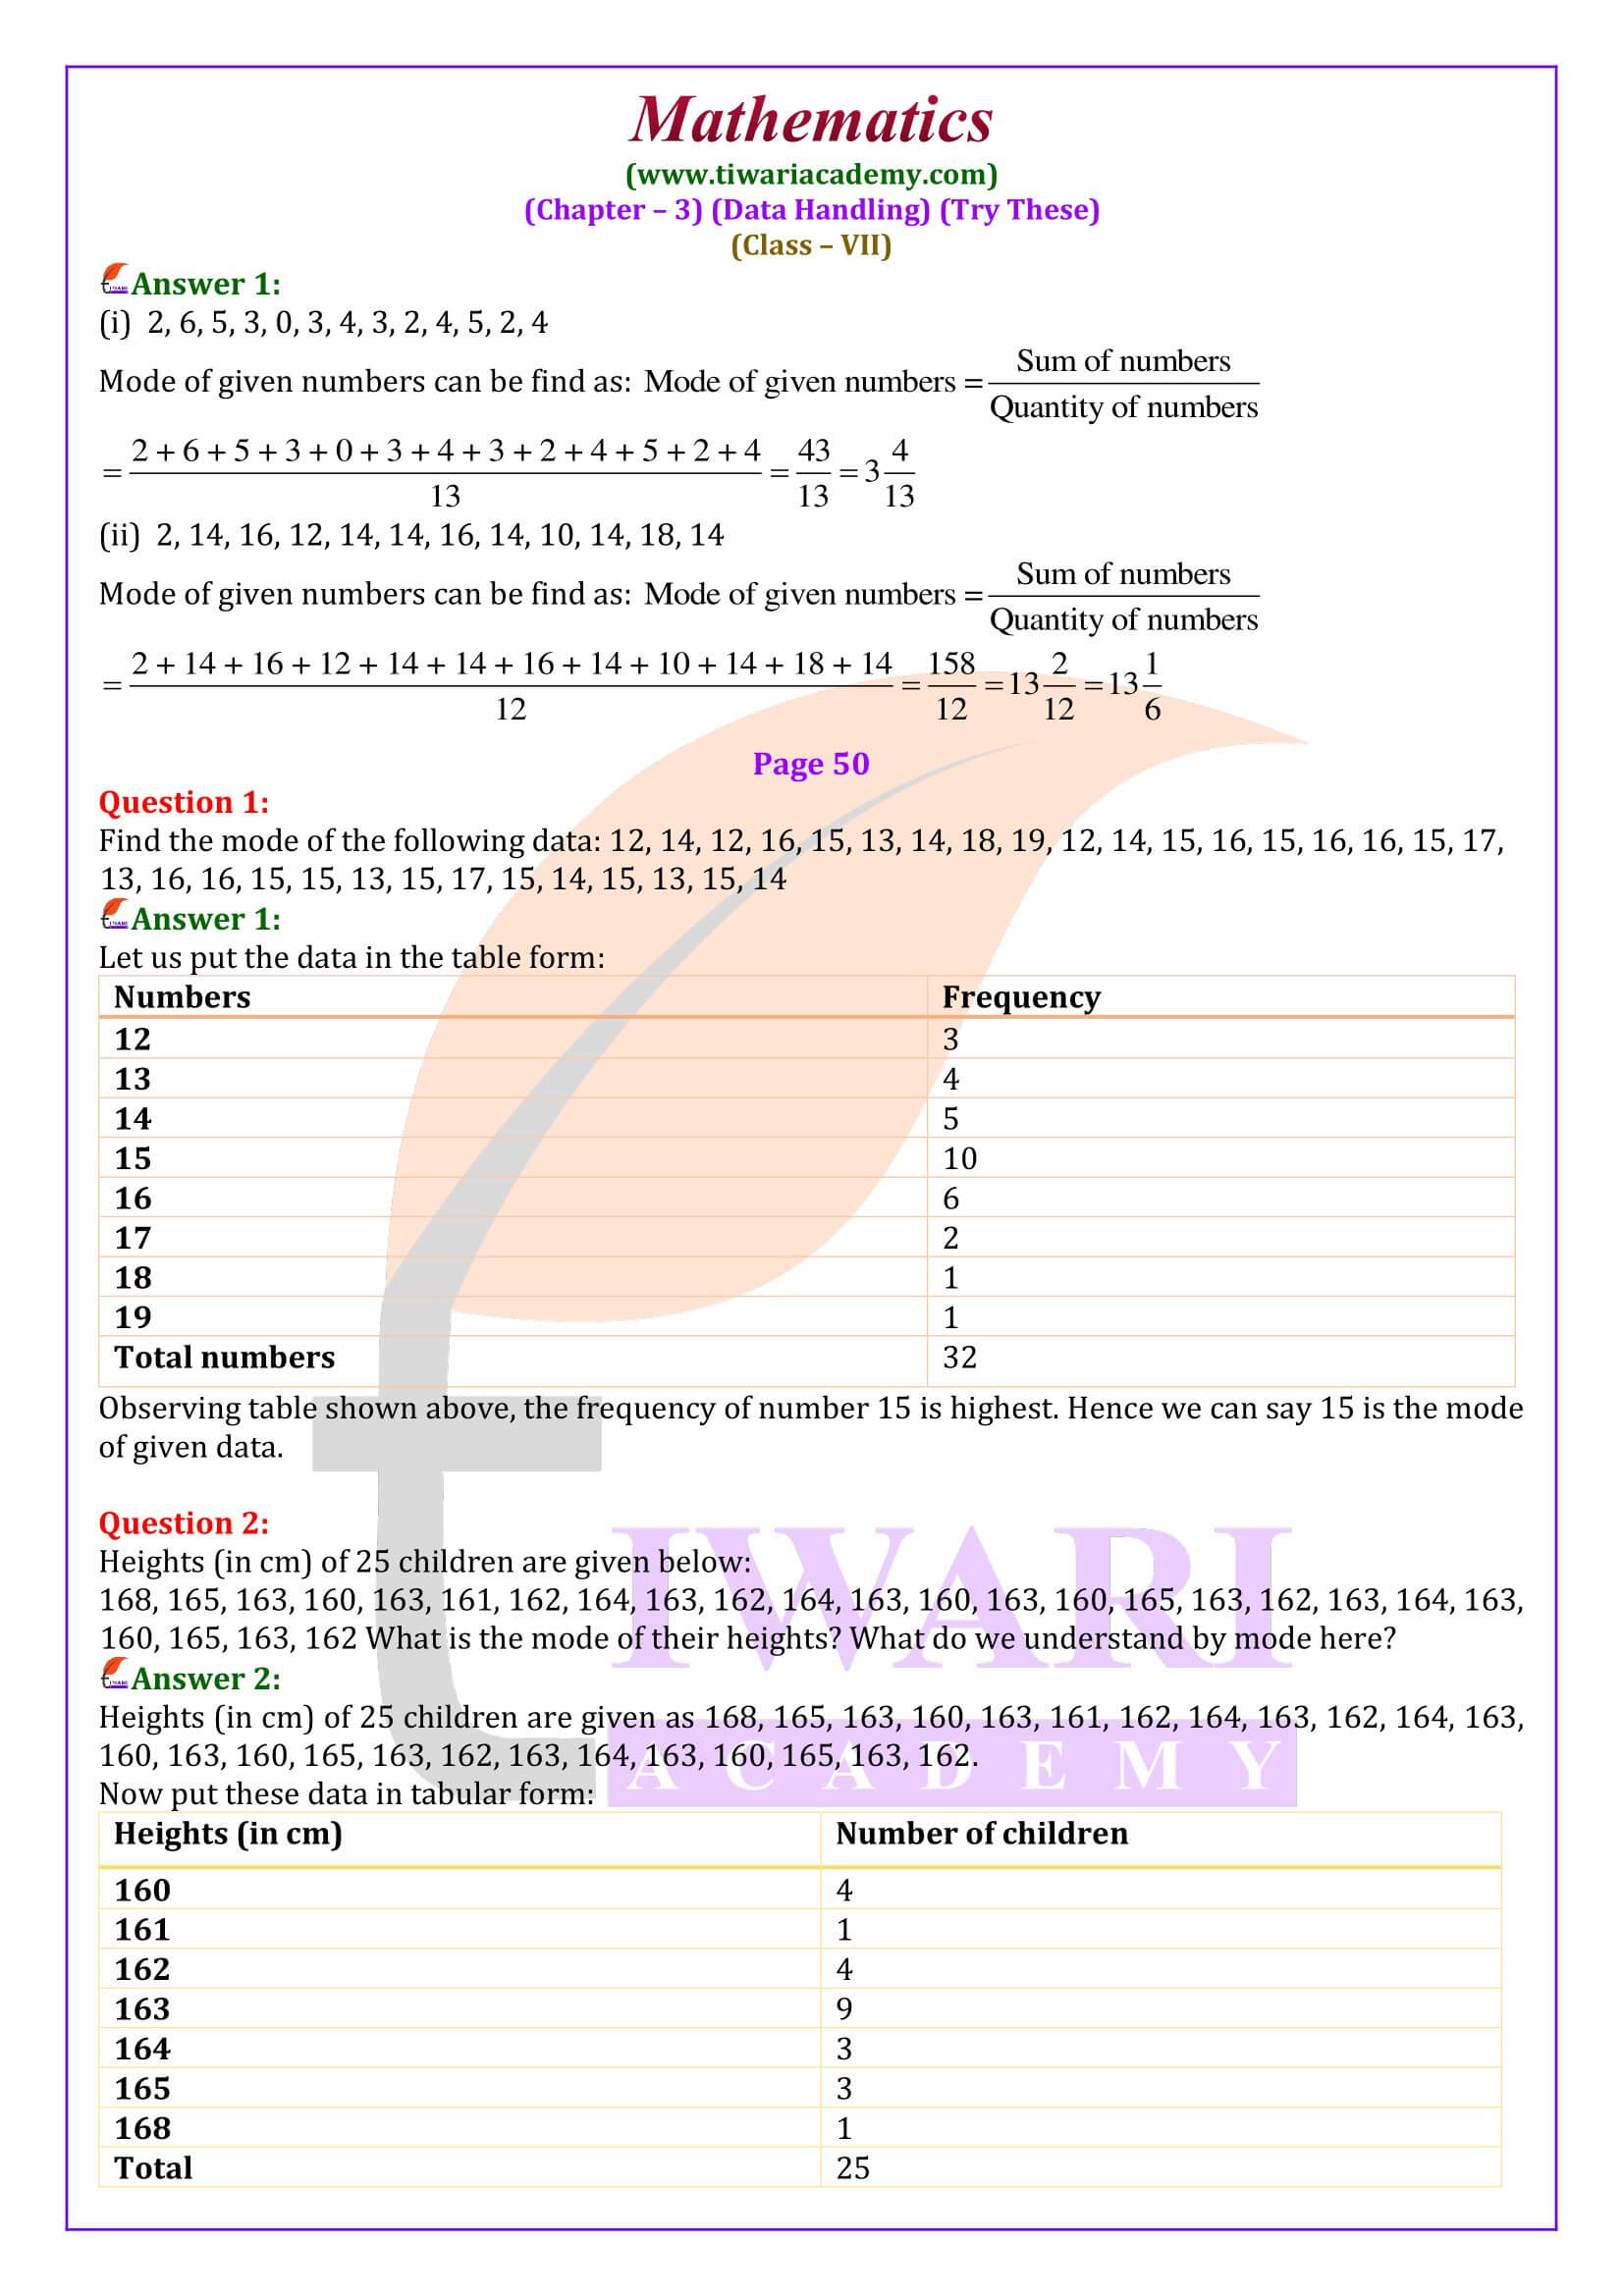
3. Mode: The mode is the observation that occurs most in the data.
4. Median: First, arrange the data in ascending or descending order. The median gives us the middle observation.
Class 7 Maths Try These Solutions
The above mentioned term provide us a numerical value related to our data. but the Bar Graph provides us a visual representation about the collected data. The concept of probability is also introduced in this chapter. There are situations in our life, that are certain to happen, have probability 1. Some that are impossible and some that may or may not happen, have probability 0.
What topics are covered in NCERT Solutions for Class 7 Maths Chapter 3 Data Handling?
NCERT Class 7 Maths Ganita Prakash Chapter 3 A Peek Beyond the Point and Exercise Solutions for Class 7 Mathematics Chapter 3, Data Handling, covers topics like data collection, organization and representation. Students learn how to arrange data in frequency distribution tables and calculate measures such as arithmetic mean, median and mode. The chapter also teaches how to represent data visually using bar graphs, making it easier to compare and interpret categories. Class 7 NCERT Math Textbook chapter 3 introduces the concept of probability to explain the likelihood of events. These comprehensive solutions help students understand the basics of data handling, ensuring they can apply these concepts effectively in real-life scenarios.
How do NCERT Solutions for Class 7 Maths Chapter 3 help students?
The textbook solutions for NCERT Mathematics Chapter 3 Data Handling simplify the understanding of crucial concepts like median, mode and range, offering step-by-step guidance. Students gain the ability to represent data using bar graphs and learn techniques to identify patterns and trends. The explanations in the NCERT Class 7 Math Solutions also introduce probability, building a solid foundation for future studies in mathematics and statistics. By working through these solutions, students enhance their problem-solving and analytical skills, which are vital for exams and practical applications in understanding datasets in real-world contexts.
Why is learning data handling important in Class 7 Maths?
Data handling is useful in NCERT Class 7 Mathematics because it lays the groundwork for understanding data organization, representation and interpretation. Chapter 3 of Class 7th Maths teaches students how to create frequency tables and calculate statistical measures like the mean, median and mode. These skills help students identify trends and analyze data systematically. Class 7 NCERT Math chapter 3 explains probability, a key concept used to determine the likelihood of events. These lessons prepare students to tackle more complex data-related problems in higher classes while developing analytical skills necessary for solving real-life challenges involving datasets.
What visual representation methods are taught in Class 7 Maths Chapter 3?
Chapter 3, Data Handling, from the NCERT Class 7 Mathematics textbook emphasizes bar graphs as a primary visual representation method. Bar graphs help students compare different categories effectively, offering a clear understanding of data distribution. Through NCERT Mathematics solutions, students learn how to construct these graphs accurately based on frequency distribution tables. This visual representation enables students to identify trends and patterns at a glance, making complex datasets more accessible and understandable. Learning this skill is essential for interpreting real-world data and enhances their ability to solve graph-related questions in exams confidently.
How does Chapter 3 introduce the concept of probability in data handling?
In NCERT Class 7 Mathematics Chapter 3, probability is introduced as a way to measure the likelihood of events. The chapter explains probability through simple examples, helping students understand its practical applications. By calculating the probability of events, students gain insight into predicting outcomes in uncertain situations. This concept is foundational for more advanced studies in mathematics and statistics. The Data Handling chapter integrates probability with other statistical tools like range, median and mode, ensuring students develop a well-rounded understanding of data analysis. The solutions provide clear explanations and examples to master this concept effectively.